
INTRODUCTION
Mental health (MH) problems are quite common in all countries (Kessler et al., 2009). One in every eight people worldwide suffers from a risk perception of mental condition. The prevalence of different mental illnesses differs according to age and gender. The most frequent problems in both men and women are the perceived feeling risk of depressive disorders and anxiety (World Health Organization, 2022). MH is critical for students with disabilities (Bartz, 2020). It can be described as a state of MH where a person understands his or her skills, is capable of dealing with daily life challenges, performs effectively and efficiently, and makes a difference in the community in which they live (World Health Organization, 2004). Scholars from diverse civilizations have defined MH in many different ways. The subject of MH encompasses a wide range of aspects, such as contentment, personal effectiveness, independence, proficiency, intergenerational dependence, and the actualization of one’s cognitive and emotional capabilities. Given the complexities inherent in a multicultural context, it becomes exceedingly challenging to provide a comprehensive definition of MH. Nonetheless, it is commonly accepted that MH goes beyond simply the lack of mental disorders (Sayers, 2001).
Mental diseases are connected with significant role impairment in first-year college students. Institutions are obliged to confront the pivotal matter of preventive interventions for mental disorders and the accompanying functional limitations (Alonso et al., 2018). Due to a variety of issues such as academic difficulty, social isolation, and stigma, students with disabilities may face additional stress and emotional struggles (Bender et al., 1999). Prioritizing MH support can assist individuals with disabilities in coping with these obstacles, as well as reducing feelings of anxiety, sadness, stress, and other unpleasant emotions and improving their general emotional well-being. This is because academic performance is heavily reliant on one’s mental wellness. Students with impairments may require personalized educational support, and managing their MH can assist them in focusing, motivating, and learning more effectively. In Saudi Arabia, approximately 17% of people with impairments attend university. It can help them engage in classroom activities, focus on tasks, retain information, and achieve success in university. MH also includes having a positive attitude toward oneself and others, as well as being happy, joyous, and loving, which are all indicators of excellent MH (Authority, 1997; MacDonald and O’Hara, 1998).
Students with disabilities often struggle to make friends or form social bonds. MH services can assist individuals in developing social skills, increasing self-esteem, and improving interpersonal connections. Studies suggest that individuals who experience disabilities within the jurisdiction of the Kingdom of Saudi Arabia (KSA) persistently face numerous societal and cultural obstacles, impeding their complete and active integration into society (Al-Odaib and Al-Sedairy, 2014). This, in turn, requires focus and attention to help and improve their integration into the universities, colleges, and community by giving them a sense of belonging. Addressing MH issues allows students with disabilities to become self-advocates. They can develop the self-advocacy skills needed to promote their well-being in school and beyond by learning to recognize their emotions, convey their needs, and seek appropriate help or accommodations (McMahon et al., 2023). When universities invest their knowledge in the mental well-being of students with disabilities, it will result in long-lasting benefits. It will set the groundwork for their academic journey by providing essential support and resources. It is therefore critical to prioritize MH for students with special needs. This can be provided through the disability services. The disability services for university students are designed to help students with special needs in their academic endeavors while also ensuring equitable access to education. It improves their emotional health, academic achievement, socialization, self-advocacy abilities, and long-term outcomes (Reyes et al., 2022). A handicap is characterized as a bodily or cognitive impediment that constrains a person’s capacity to accomplish duties in a manner comparable to the remainder of the population within the identical age bracket (World Health Organization, 1980).
Few studies have explored the implications of psychological wellness on students with disability problems. This work aims to acquire additional knowledge about how the fundamental components of psychological welfare, including despair, anxiety, and stress, affect the QOL of disabled university students. Additionally, the research seeks to fill the writing gap in the scholarly resources by illuminating the moderating function expected to be played by the university support to influence the relationship that exists among these variables as well as the QOL. Moreover, this investigation stands out due to its execution within Saudi Arabian academic institutions, in contrast to the majority of preceding studies which were conducted in Western nations. Our anticipation is that our model will furnish the current body of literature with invaluable findings. Our investigation is composed of seven primary divisions, encompassing the main introduction, an examination of existing literature, the description of materials and techniques employed in our research, the presentation of the main findings, a deliberation on the outcomes, a concluding statement, and an analysis of the potential impacts of this study.
LITERATURE REVIEW
Risk perception of mental health (RPMH) disorders and quality of life (QOL) for disabled students
RPMH disorders are characterized as a state of being characterized by a sense of wellness in which an individual recognizes and acknowledges their innate capabilities, exhibits the capacity to effectively navigate the challenges encountered in daily life, achieves notable success and productivity, and actively contributes to the betterment of their community (World Health Organization, 2004). In the realm of education, especially for students with disabilities, QOL is becoming increasingly crucial, especially for their MH (Ager, 2002; Sacks and Kern, 2008). QOL refers to the overall well-being and satisfaction with different needs of person’s life (The WHOQOL Group, 1998). It is a subjective evaluation that takes into consideration physical, mental, social, and emotional components.
QOL is a notion that reflects each individual’s subjective perception of their level of contentment with their living surroundings. The phrase “quality of life domains” pertains to the collection of elements that constitute an individual’s state of personal satisfaction (Schalock, 2004). Factors such as income, education, healthcare, employment opportunities, social support, and environmental conditions have the potential to exert an influence on the QOL (Schalock et al., 2002). A state of high QOL is characterized by the presence of sound bodily and mentality health, access to healthcare services of optimal standards, educational and employment prospects that are of commendable quality, the existence of a social network that provides support and encouragement, and an environment that is secure and pleasant. According to the international organizations, QOL is explained as one’s personal perception related to their living circumstances and how they align with their objectives, standards, priorities, and concerns, within the framework of their respective cultural and value systems (The WHOQOL Group, 1993).
Maintaining a great QOL necessitates strong MH. A person with strong MH is more likely to cope with and handle daily challenges, have healthy relationships, and experience a feeling of purpose and fulfillment. They are also more capable of dealing with problems, achieving personal goals, and maintaining an optimistic attitude in life. MH matters can profoundly influence one’s overall QOL. As indicated by research results, college students who disclosed various forms of impairments experienced a diminished state of contentment, which correlated with feelings of anxiety and sadness (Davis et al., 2009). MH is inextricably tied to overall QOL, the impact of this phenomenon is significant, as it exerts a substantial influence on many elements of an individual’s well-being. RPMH, in particular, has a direct influence on levels of melancholy, stress, general good effects (positive emotions), and life satisfaction.
Many researchers have discovered a correlation between mental stability and the quality related to one’s style of life. Additionally, they have observed that this correlation positively influences students by aiding in the mitigation of negative emotions such as sadness and stress, while concurrently promoting positive affect and life satisfaction (Cleofas, 2020). Understanding this link is crucial for helping teenagers improve their psychological wellness and general well-being. Students frequently experience sadness and stress, which they ascribe to academic pressure, social challenges, and personal aspirations.
Students’ capacity to function properly might be hampered by persistent sorrow and excessive levels of stress, affecting their academic performance and social connections. These challenges can be effectively addressed or mitigated by providing tools and support systems such as counseling services, stress management programs, and peer support groups. Encouraging a positive emotional state is crucial for the psychological health of students. The endorsement of consistent engagement in physical exercise, involvement in artistic pursuits, and fostering of significant relationships can all contribute positively to students’ feelings of happiness and contentment. According to the findings, people perceived the level of supported service for the fundamental people psychological satisfaction of their life autonomy and freedom level, competence level, and their health satisfaction level as well as the QOL (O’Shea et al., 2023).
We argue that all students require a high standard of living. Therefore, universities must guarantee that students with disabilities are afforded a superior standard of living so as to foster inclusivity and equitable representation within the university community. Given an environment that is accepting and supportive, students who are faced with some disabilities are more inclined to experience a sense of worth and belonging. This fosters the cultivation of a congenial social atmosphere and fosters strong interpersonal connections among the student body. The implementation of coping training programs that concentrate on the resolution of problems can effectively facilitate the integration of students with disabilities, thereby augmenting their QOL (Koca-Atabey et al., 2011). An inclusive teaching practice and attractive classroom with a conducive learning environment should be recognized as crucial safeguards for students with disabilities (McMillan and Jarvis, 2013).
Depression and QOL for disabled students
Depression is estimated to affect over 300 million people worldwide, and the condition is listed by the WHO as the single biggest cause of global disability. Depression appears to have grown during the past 10 years (World Health Organization, 2014).
According to the Global Mental Health Report issued by the WHO in June 2022, a notable figure of 246 million people globally experienced severe depression, demonstrating a substantial surge of 28% within a mere 12-month span (World Health Organization, 2022). It is expected to be a major contributor to the global illness burden by 2030 (World Health Organization, 2018). Depression results in substantial negative effects on the QOL of students with disabilities (Vancini et al., 2019). It frequently causes feelings of despair, hopelessness, and disinterest in activities. This can make it difficult for the student to enjoy life, establish relationships, and follow their interests. It contributes to feelings level of loneliness, low level of self-esteem, negative self-perception, as well as anxiety (Hettema, 2008).
Depression is a widespread, debilitating, and potentially fatal mental illness. The WHO ranks it as the single greatest contributor to worldwide disability (Stringaris, 2017). Depression frequently hinders concentration, memory, and motivation, which makes it hard for disabled students to focus on their studies. This may result in poor academic achievement, exacerbating feelings of stress and low self-esteem. The severity of depression symptoms has negatively influenced the Academic Self-Concept Scale scores significantly. It has been discovered in a prior investigation that the physical stability of health and QOL of students classified as disabled are adversely affected due to the considerable prevalence of depression among them. This high level of depression harms their QOL negatively (Barbosa-Camacho et al., 2022).
It can result in weariness, changes in appetite or sleep patterns, and a compromised immune system. This can increase the student’s susceptibility to disease and make controlling any physical limitations more challenging. The results will be lower physical activity (Ibrahim et al., 2022).
Depression can hinder a student from doing their daily duties like hygiene, eating, and sleeping. This might result in a decrease in overall well-being as well as emotions of irritation or helplessness and negatively influence the QOL (Jenkins et al., 2013).
The study found a substantial link between depression severity and poorer QOL, and the association was found negative and consistent across time when researchers measured its impact on the QOL (Sivertsen et al., 2015; Alsubaie et al., 2019). Other authors found that a major opposite relationship exists between depression and QOL (Jho, 2001). This shows that depression has played a negative role in the QOL of students with disabilities. By referring to the previous studies, we observe a negative implication and impact of the depression on QOL for all people, especially students with disabilities. This negative relationship has different negative consequences on the academic and learning life of students who are classified as disabled (Awadalla et al., 2020).
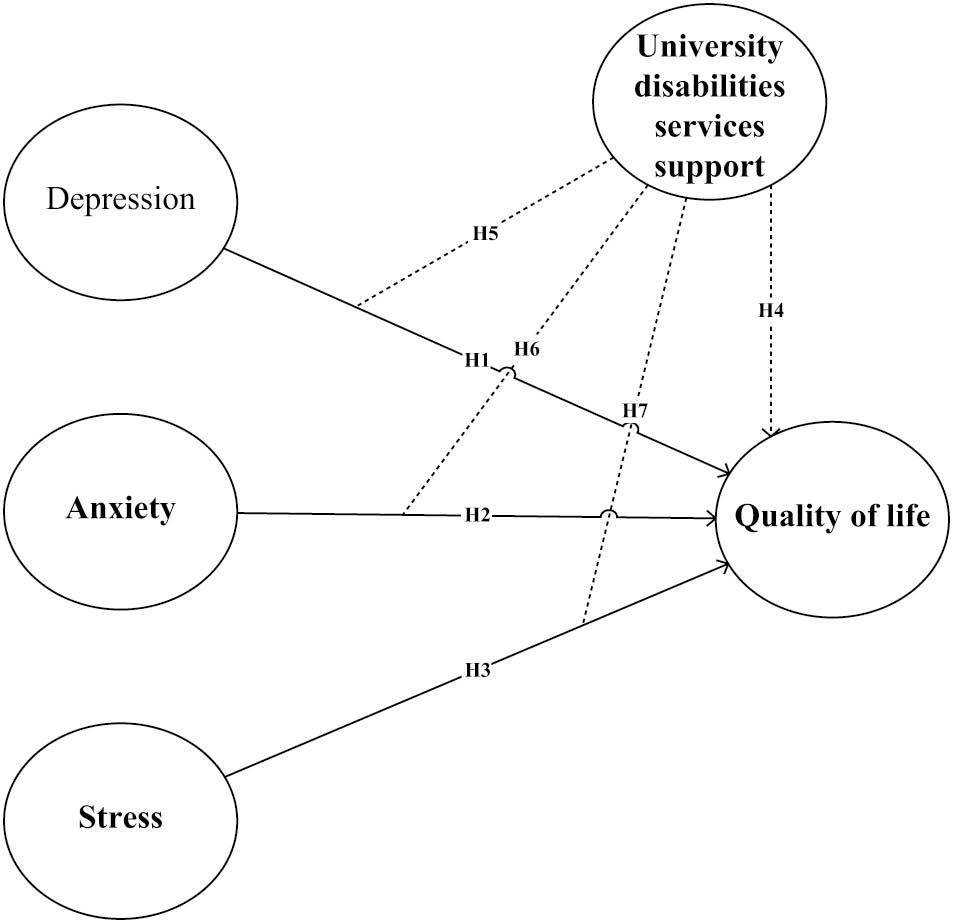
H1: Depression has a negative effect on the QOL for disabled students.
Anxiety and QOL for disabled students
Anxiety is defined as a forward-looking state of mind connected with preparing for achievable, forthcoming unpleasant occurrences (Barlow, 2004). The findings of the studies support the assumption that anxiety symptoms are related to a negative QOL (Marck et al., 2017; Dong et al., 2020). Anxiety has the potential to exert an adverse influence on multiple facets of an individual’s existence, culminating in diminished efficacy, a diminished state of being, and an overall compromised state of welfare and QOL for individuals (Vancini et al., 2019). One of the most significant ways in which anxiety impacts QOL is through its impact on daily functioning.
Excessive worry, restlessness, difficulty concentrating, and impatience are all signs of anxiety that can make it difficult for people to carry out their regular duties properly. This phenomenon may exert an adverse influence on their efficacy and achievement in professional or academic settings, thereby resulting in heightened uneasiness and dissatisfaction. Indicators of anxiety may also impede interpersonal relations and societal engagement, both of which are essential for a superior standard of living. As a result, individuals with elevated anxiety levels have cultivated a diminished standard of living (Hall and Goldberg, 1977).
The negative impact of anxiety on students who are faced with disability has been studied previously. Individuals who are suffering from anxiety always struggle to initiate or sustain relationships, as well as participate in social activities. Fear of being evaluated or criticized by others can lead to avoidance behaviors and social isolation, preventing meaningful connections and lowering overall life satisfaction (Saatcioglu et al., 2008; Romão et al., 2009).
Anxiety can cause physiological responses such as increased heart rate, muscle tension, and disrupted sleep patterns if it is consistently elevated (Weinberger et al., 1979; Yuliana et al., 2023). The presence of these bodily manifestations can detrimentally affect an individual’s overall physical condition and state of being as time progresses, thereby contributing to a diminished standard of living. Moreover, it is common for anxiety to concurrently manifest with other psychological disorders like depression or substance abuse, amplifying the adverse repercussions on one’s QOL (Romão et al., 2009; Hakami et al., 2017). A high level of anxiety among students with disabilities can negatively affect their QOL, which might, in turn, have a negative effect on their academic performance.
H2: Anxiety has a negative effect on the QOL for disabled students.
Stress and QOL for disabled students
Stress is the body’s generic response to any demand (Selye, 1936). Students with disabilities frequently experience particular problems and barriers in their academic and personal lives, which can contribute to heightened stress levels. Stress levels would dynamically increase mind wandering and create negative feelings which affect the QOL negatively (Du and Xu, 2019). Students’ moods are negatively influenced by their level of stress (Teixeira et al., 2022). Those with disabilities had slightly more academic stress than those without disabilities (Heiman, 2006). Arising from their condition, disabled students may experience additional academic problems, such as difficulty with specific courses or assignments, the need for accommodations, and the need to navigate systems that were not intended with their needs in mind.
The connection between stress experienced by students and a range of adverse consequences, encompassing both the general QOL and the state of welfare pertaining to health, has been established (Yuliana et al., 2023). Several researchers have found evidence to support this link. The authors found that student stress had a negative direct impact on overall QOL in one study (Hudd et al., 2000). Stress experienced by students has the potential to show an adverse influence on the QOL pertaining to health (Damush et al., 1997).
Stress was linked to worse physical health, higher sensitivity to sickness, and a diminished ability to cope with health issues. Stress can result in a negative effect on learner’s physical and psychological well-being. The final tests, grade competitiveness, time constraints, instructor and lecture room environment, and employability readiness were recognized as the primary academic stressors among college students in research (Murphy and Archer, 1996). Researchers found that stress exhibited a negative association with the physical fitness as well as mental well-being of new generation, as well as their QOL (Chakraborty et al., 2019).
H3: Stress has a negative effect on the QOL for disabled students.
University’s disability services and QOL for disabled students
The provision of disability services within the university building plays a pivotal role in enhancing the overall satisfaction and academic achievements of students facing impairments. It contributes positively to their QOL (Abreu et al., 2017; Edwards et al., 2022). These services are designed to give assistance, accommodations, and resources to impaired students to provide equitable educational access, facilities, and opportunities. Academic accommodations are one of the key ways in which disability services improve students’ QOL (Blasey et al., 2023).
Disability services include assistive technologies, adjustment programs, therapy services, academic counseling, orientation training, direct academic support, and treatments to develop poor academic abilities and skills (Rath and Royer, 2002). The university’s disability services assist students with disabilities in navigating the emotional and psychological problems that their impairment may provide. Having access to a support system can positively impact the QOL, and overall welfare of university students who are classified as facing disability problems (Herbert et al., 2020; Herbert, 2022). Previous studies revealed that higher disability service standards impacted positively on the QOL of students with disabilities. These include special services like stairs, elevators, wheelchairs, accessible bathrooms, and special parking facilities (Blasey et al., 2023).
International universities have invested in building tools such as exam accommodations, services for people with disabilities, and wellness promotion initiatives. These help improve and positively affect the QOL of students showing some disability problems (Römhild and Hollederer, 2023).
H4: UDSS has a positive effect on the QOL for disabled students.
This research aims to highlight that UDSS moderates the existing relationship between depression, anxiety, stress, and the QOL. This moderation activity is very critical to fill the expected gap in the previous as well as current literature. In Saudi Arabia, there has been no study to explore these moderation effects. The moderate function of university services is related to the extent to which these services can exert influence on the existing relationships between depression, anxiety, stress, and the welfare of students who are faced with disability conditions.
H5: The UDSS moderates the relationship between depression and QOL for disabled students.
H6: The UDSS moderates the relationship between anxiety and QOL for disabled students.
H7: The UDSS moderates the relationship between stress and QOL for disabled students.
The above-mentioned hypotheses were designed and developed by the researchers after a thorough coverage of the previous literature relating to our study objectives.
MATERIAL AND METHODS
To conduct a thorough analytical evaluation of the study framework, we adopted a quantitative approach, utilizing the cross-sectional data collection method. The objective is to assess the influence of the MH of disabled students on their QOL, with a focus on the mediating role played by UDSS. Primary data were gathered from the study’s targeted population through online questionnaires. These questionnaires were structured into two distinct sections. The introductory part of the survey aimed to collect demographic data from the disabled students, including factors like age, gender, university affiliation, educational level, and disability type (refer to Table 1 for details). Furthermore, the second part of the survey is dedicated to capturing data concerning the relationships between the research constructs. To assess the RPMH of disabled students, we utilized the Depression (Drsn), Anxiety (Enzty), and Stress (Strs) Scale-21 Items (DASS-21), which evaluates these symptoms of MH disorder using 21 items. The scale demonstrated strong internal consistency across all three dimensions: depression (α = 0.965), anxiety (α = 0.954), and stress (α = 0.974). Comprising 21 items, this scale is adaptable for use in various settings. Its design aims to gauge an individual’s experience of negative emotions over the past week, with each subscale comprising seven items. Participants were kindly requested to assess the extent of their agreement with each item about their experiences over the past week using a four-level Likert scoring system, ranging from 0 (indicating no agreement) to 3 (indicating a high level of agreement) (Lovibond and Lovibond, 1995). Moreover, we incorporated the “Satisfaction with Life Scale” (SWLS), formerly created by Diener et al. (1985), as part of our study. This scale, consisting of five items (α = 0.937), was employed to assess QOL among disabled students (DSQOL). The SWLS aims to gauge an individual’s overall cognitive assessment of their life satisfaction. Students were inquired about their degree of agreement with different statements associated with their happiness. Some examples of these statements include: “My life circumstances are excellent” and “I wouldn’t change much if I could relive my life.” Each statement was evaluated on a five-point Likert scale, with values ranging from 1 (representing strong disagreement) to 5 (representing strong agreement). Finally, UDSS was evaluated using a four-item scale derived from Lombardi et al. (2011), and the items on this scale exhibited strong internal consistency (α = 0.946).
Respondents’ profile.
| Category | Group | Frequency | % |
|---|---|---|---|
| Gender | Male | 352 | 55.0 |
| Female | 288 | 45.0 | |
| Age group | 17-20 | 237 | 37.0 |
| 21-24 | 262 | 41.0 | |
| 25-28 | 141 | 22.0 | |
| Disability | Physical impairment | 166 | 26.0 |
| Visual impairment | 173 | 27.0 | |
| Hearing impairment | 160 | 25.0 | |
| Speech impairment | 141 | 22.0 | |
| Universities | KFU | 237 | 37.0 |
| IAU | 211 | 33.0 | |
| UOH | 192 | 30.0 | |
| Weight | 55-72 | 192 | 30.0 |
| 73-90 | 211 | 33.0 | |
| 91-110 | 237 | 37.0 | |
| Height | 145-179 | 480 | 75.0 |
| ≤180 | 160 | 25.0 |
Abbreviations: KFU, king faisal university; IAU, imam abdulrahman bin faisal university; UOH, university of hail.
After the questionnaire positively passed the pretest, the main data collection phase of the study commenced. We distributed the questionnaire to our targeted student population through social media platforms and official university email channels during the months of May and June 2023. To ensure a diverse representation of disabled students and to measure the effect of RPMH on their standard of living, with a key focus on the moderating impacts of UDSS, we employed a nonprobability convenience sampling method. We have recruited 35 university student enumerators to collect the required data from the targeted sample (disabled students). To prepare these enumerators, we conducted an orientation session to acquaint the enumerators with the research project’s goals, and the ethical considerations concerning disabled students. Before asking the participants to complete the survey, enumerators were trained to first obtain their consent and address any concerns. We make it clear that sensitivity and respect are paramount. To ensure and maintain the participant confidentiality, enumerators were aware of the privacy concerns surrounding sensitive information and how to protect these data. In total, we received 700 responses to the questionnaire from students. After a meticulous review of these submissions, 640 of them were deemed valid, resulting in an impressive response rate of 91%. Consequently, a total of 640 questionnaires were obtained to facilitate the analysis for both measurement and structural models, utilizing the partial least squares (PLS) path modeling approach, which falls within the domain of structural equation modeling (SEM). As depicted in Table 1, the gender distribution among the surveyed disabled students is relatively balanced, with 55% being male and 45% female. This suggests that the research sample represents both genders fairly evenly, which is important for a comprehensive study on the impact of disability and support services. The age distribution is diverse, with a significant portion (40%) falling within the 20-25 age group. This suggests that a substantial number of university students with disabilities are in the typical college-age range (21-24 years old). It is worth noting that a considerable portion (37%) of the respondents is ≤20 years old, indicating the inclusion of younger students in the study. The disability type distribution reflects the varied nature of disabilities among the respondents. Visual impairment is the most prevalent, accounting for 27%, followed by physical (mobility) impairment at 26%. This diversity in disability types is essential for assessing how different conditions may affect QOL. As shown in Figure 1, these demographic statistics provide insights into the diversity of the research sample, which is crucial for understanding how various factors, such as disability type and university support services, influence DSQOL.
Dealing with missing value
“Missing data is a common issue in sample surveys” (Little, 1988). This often poses challenges when analyzing multivariate data in the fields of social and behavioral sciences (Rezaei and Ghodsi, 2014). Missing values can arise during the data collection process through questionnaires when respondents are unwilling, unable, or neglect to respond to certain questions. These instances are beyond the control of researchers and can complicate the subsequent statistical analysis (Fokianos, 2007). In his study, Gold and Bentler investigated various techniques to handle missing values (Gold and Bentler, 2000). The study revealed that the “Expectation Maximization Method” (EMM) proves to be an effective approach to address this challenge. Multiple imputation first introduced by Rubin (2004) is “a simulation technique that replaces each missing datum with a set of complete data >1 plausible values” (Schafer and Olsen, 1998). Additionally, the application of EMM has been found to mitigate measurement errors (Ghosh-Dastidar and Schafer, 2003), and is particularly valuable when dealing with missing data in extensive datasets. Consequently, we employed the Expectation Maximization algorithm (EMA) utilizing SPSS software (version 21) to handle missing values (Little, 1988). To begin, we calculated Little’s MCAR (missing completely at random) χ2 statistic through the EMA procedure to assess whether the missing data were indeed occurring at random. The results revealed that Little’s MCAR test resulted in a chi-square value of 168.648 with 158 degrees of freedom and a significance level of 0.267, revealing that the issue of missing data could be considered as occurring at random. Subsequently, the EMA was implemented to impute the missing data appropriately, effectively addressing the issue of missing values.
Dealing with common method variance (CMV)
CMV presents a significant concern in scientific research and generally, in any self-report survey study (Spector, 2006), as it poses a threat to the validity of the relationships observed between constructs (Williams and Brown, 1994; Reio, 2010). CMV is typically more likely to arise when data are gathered from a single source (Avolio et al., 1991). Being an inherent aspect of the measurement employed scale, CMV can jeopardize research findings in the social and behavioral sciences, necessitating careful consideration by researchers (Podsakoff et al., 2003). CMV can potentially affect item reliability and the covariation among latent unobserved constructs (MacKenzie and Podsakoff, 2012), thereby influencing the structural relationships (Kline et al., 2000). To mitigate the risk of CMV, Reio suggests two viable solutions: procedural design and statistical control (Reio, 2010).
Aligning with the approach advocated by Podsakoff et al. (2003), this study took proactive steps to mitigate the issue of CMV during the questionnaire design phase. Strategies such as avoiding common answer effects, agreement biases (both negative and affirmative reply to tendencies), variable characteristic effects, common scale presentations, variable priming effects, and excessive scale length were carefully implemented throughout the questionnaire. Additionally, a statistical assessment known as Harman’s one-factor test was evaluated. The output of this analysis provides assurance that CMV does not pose a significant concern in the context of this study.
Nonresponse bias treatment
Nonresponse bias is a significant issue in survey methodology that demands attention from researchers (Rezaei and Ghodsi, 2014). This concern becomes especially pronounced in the context of online surveys (Menachemi, 2011). Failure to address nonresponse bias can hinder the broader applicability and generalizability of research findings, underscoring the importance of researchers actively managing this issue (Michie and Marteau, 1999). “Response bias occurs when people who reply to a questionnaire vary substantially from those who were invited but did not participate” (Menachemi, 2011), in which “non-participants are not represented by the participants” (Thompson et al., 2014). Addressing nonparticipation in research can be a complex endeavor, primarily because researchers often lack information regarding nonparticipant issue (Lin and Schaeffer, 1995). Nevertheless, researchers must actively tackle nonresponse bias to mitigate concerns related to nonparticipation (Bowling, 2014). Several methods for analyzing nonresponse bias are commonly employed, including the analysis of identified characteristics, examination of nonresponder subsamples, wave analysis, and linear extrapolation (Lewis et al., 2013). In this study, to confirm that nonresponse bias did not significantly impact the findings, a comprehensive three-step approach based on the continuum-of-resistance theory (Lin and Schaeffer, 1995) was undertaken. First, an analysis of known demographic characteristics, such as age and gender, revealed no significant differences between groups. Additionally, a comparison of respondents from different universities was conducted to verify the similarity of samples obtained through the two data collection modes, with no significant differences observed between these groups. Second, a wave analysis was performed to compare variables between early and late responders.
Measurement and structural model evaluation
Utilizing “Structural Equation Modeling” (SEM) for hypothesis testing in the causal model offers distinct advantages over first-generation methods, for example, principal component analysis, factor analysis, and regression analysis (Hair et al., 2011). SEM operates by integrating various research procedures in a comprehensive and holistic manner (Chin, 2009). In the realm of multivariate data analysis, two prominent methods in the second generation are maximum likelihood estimation (MLE) (Jöreskog, 1978) and PLS (Jöreskog, 1978), each with distinct applications in research (Vinzi et al., 2010). Deciding the adequate statistical analysis method continues to be a challenging decision for researchers in social sciences and business management (Naderian, 2017). PLS, recognized as a variance-based SEM, offers substantial advantages, particularly in the fields of social science studies (Hair et al., 2011). It excels in elucidating relationships among sets of various observed variables (Hair et al., 2012).
Researchers have pointed out that MLE relies on the factor dimensions concept, making it particularly appropriate for theory testing but requiring a larger volume of data (Fornell et al., 1990; Chin, 2009). In contrast, PLS is grounded in the component construct concept, making it well-suited for justifying intricate interrelationships (Sarstedt, 2008). PLS represents a method that operates without imposing stringent assumptions regarding distribution, sample size, or measurement scale (Vinzi et al., 2010). The PLS path modeling approach stands out as a valuable method for modeling complex cause-and-effect interrelationships, particularly when dealing with multiple latent constructs indirectly measured by several indicators (Gudergan et al., 2008). However, it should be noted that PLS is not ideally suited for confirmatory testing, as indicated by Chin (2009) and Westland (2007).
Furthermore, PLS excels in accommodating heterogeneity inside the framework of path modeling, making it a valuable asset when the initial focus of the analysis centers on prediction accuracy (Sarstedt, 2008). As per Henseler and Chin (2009), the evaluation of SEM entails two key steps: first, the assessment of the measurement model, and second, the analysis of the results of the structural model, following a two-stage procedure. The PLS path modeling set of rules encompasses both outer and inner calculation phases (Hair et al., 2021a). The researchers have emphasized the importance of satisfying certain nonparametric assessment criteria, such as construct reliability (>0.6), outer loadings (>0.7), indicator reliability (>0.5), and average variance extracted (AVE) (>0.5) (Ringle et al., 2010). In the realm of measurement assessment, construct validity is defined as “the extent to which an operationalization measures the concept it is supposed to measure” (Bagozzi et al., 1991). Moreover, the structural model involved an evaluation of the R2 measures and the magnitude and statistical significance of the path coefficients. This was accomplished by employing a bootstrapping procedure consisting of 5000 resamples, following the methodology outlined by Hair et al (2011). Consequently, in this study, the estimation of the measurement and structural models was conducted using the PLS algorithm, along with the bootstrapping and blindfolding procedures, through SmartPLS software version 4.
RESULTS
Measurement model evaluation
To estimate the measurement models reflectively, several key metrics were examined, following the approach outlined by Hair et al. (2013). As summarized in Table 2, the outer loadings’ estimate for the reflective factors notably exceeded the minimum limit value of 0.70. The calculated composite reliability (CR) values demonstrated that all the reflective factors exhibited high levels of internal reliability. Additionally, the AVE values, which indicate convergent validity, comfortably surpassed the minimum ceiling level of 0.50, affirming convergent validity across all factors. Internal reliability and consistency, as measured by Cronbach’s alpha, also comfortably exceeded the minimum score level of 0.70. The outer t-value was employed to assess the significance level of individual items. In the evaluation of discriminant validity, both the Fornell and Larcker criterion (Fornell and Larcker, 1981) and the cross-loading criterion were considered.
Construct validity.
| Factors | Variables | Loadings | AVE | Composite reliability (CR) | α | T-statistic | VIF |
|---|---|---|---|---|---|---|---|
| RPMH | 0.815 | 0.965 | 0.962 | ||||
| Depression | |||||||
| Dprsn1 | 0.909 | 69.695 | 4.258 | ||||
| Dprsn2 | 0.900 | 53.675 | 3.861 | ||||
| Dprsn3 | 0.908 | 54.673 | 4.427 | ||||
| Dprsn4 | 0.913 | 57.200 | 4.898 | ||||
| Dprsn5 | 0.901 | 47.786 | 4.175 | ||||
| Dprsn6 | 0.897 | 45.601 | 3.903 | ||||
| Dprsn7 | 0.892 | 47.412 | 3.627 | ||||
| Anxiety | 0.782 | 0.962 | 0.954 | ||||
| Enzty1 | 0.862 | 58.001 | 3.804 | ||||
| Enzty2 | 0.897 | 74.257 | 4.346 | ||||
| Enzty3 | 0.863 | 62.872 | 3.580 | ||||
| Enzty4 | 0.870 | 65.642 | 4.331 | ||||
| Enzty5 | 0.903 | 91.408 | 4.988 | ||||
| Enzty6 | 0.897 | 69.716 | 4.749 | ||||
| Enzty7 | 0.899 | 91.093 | 4.081 | ||||
| Stress | 0.785 | 0.958 | 0.947 | ||||
| Strs1 | 0.816 | 32.606 | 2.414 | ||||
| Strs2 | 0.892 | 59.684 | 4.582 | ||||
| Strs3 | 0.867 | 54.892 | 4.270 | ||||
| Strs4 | 0.888 | 62.995 | 3.931 | ||||
| Strs5 | 0.882 | 52.581 | 3.619 | ||||
| Strs6 | 0.889 | 74.477 | 4.080 | ||||
| Strs7 | 0.859 | 49.526 | 3.568 | ||||
| Quality of life | 0.799 | 0.937 | 0.937 | ||||
| QOL1 | 0.913 | 76.507 | 4.228 | ||||
| QOL2 | 0.898 | 55.787 | 3.610 | ||||
| QOL3 | 0.907 | 73.478 | 3.864 | ||||
| QOL4 | 0.909 | 70.310 | 3.700 | ||||
| QOL5 | 0.840 | 42.346 | 2.276 | ||||
| University disability service support | 0.859 | 0.974 | 0.946 | ||||
| UDSS1 | 0.934 | 37.417 | 4.134 | ||||
| UDSS2 | 0.921 | 71.656 | 4.302 | ||||
| UDSS3 | 0.910 | 73.921 | 4.044 | ||||
| UDSS4 | 0.943 | 26.936 | 4.394 |
Abbreviations: AVE, average variance extracted; RPMH, risk perception of mental health; VIF, variance inflation factor.
The off-diagonal scores (Table 3) represent the correlations matrix among the latent factors. The common scores between the constructs are essentially squared correlations. Upon examining the loadings across the columns, as presented in Table 4, it becomes evident that in all instances, the loadings of an indicator on its own construct surpass all of its loadings on other constructs. Consequently, these findings unequivocally establish the presence of discriminant validity among all the constructs.
Discriminant validity—Fornell and Larcker criterion (Fornell and Larcker, 1981).
| 1 | 2 | 3 | 4 | 5 | |
|---|---|---|---|---|---|
| 1-Anxiety | 0.884 | ||||
| 2-Depression | 0.630 | 0.903 | |||
| 3-Quality of life | −0.452 | −0.403 | 0.894 | ||
| 4-Stress | 0.635 | 0.368 | −0.362 | 0.871 | |
| 5-University disability service support | 0.290 | 0.503 | 0.271 | 0.142 | 0.927 |
The bold values show the significant correlations between variables.
Discriminant validity—loading and cross-loading scores.
| Anxiety | Depression | Quality of life | Stress | University disability service support | |
|---|---|---|---|---|---|
| Dprsn1 | 0.583 | 0.909 | −0.364 | 0.367 | 0.462 |
| Dprsn2 | 0.542 | 0.900 | −0.393 | 0.313 | 0.461 |
| Dprsn3 | 0.598 | 0.908 | −0.361 | 0.351 | 0.432 |
| Dprsn4 | 0.560 | 0.913 | −0.315 | 0.324 | 0.483 |
| Dprsn5 | 0.541 | 0.901 | −0.327 | 0.285 | 0.473 |
| Dprsn6 | 0.550 | 0.897 | −0.360 | 0.315 | 0.416 |
| Dprsn7 | 0.603 | 0.892 | −0.407 | 0.363 | 0.455 |
| Enzty1 | 0.862 | 0.538 | −0.372 | 0.475 | 0.213 |
| Enzty2 | 0.897 | 0.570 | −0.496 | 0.551 | 0.184 |
| Enzty3 | 0.863 | 0.550 | −0.360 | 0.552 | 0.341 |
| Enzty4 | 0.870 | 0.551 | −0.334 | 0.579 | 0.314 |
| Enzty5 | 0.903 | 0.601 | −0.368 | 0.600 | 0.340 |
| Enzty6 | 0.897 | 0.536 | −0.419 | 0.556 | 0.223 |
| Enzty7 | 0.899 | 0.562 | −0.412 | 0.625 | 0.223 |
| QOL1 | −0.365 | −0.350 | 0.913 | −0.281 | 0.246 |
| QOL2 | −0.397 | −0.370 | 0.898 | −0.321 | 0.223 |
| QOL3 | −0.395 | −0.346 | 0.907 | −0.296 | 0.246 |
| QOL4 | −0.393 | −0.378 | 0.909 | −0.297 | 0.231 |
| QOL5 | −0.463 | −0.354 | 0.840 | −0.412 | 0.262 |
| Strs1 | 0.662 | 0.449 | −0.334 | 0.816 | 0.201 |
| Strs2 | 0.519 | 0.276 | −0.286 | 0.892 | 0.115 |
| Strs3 | 0.429 | 0.223 | −0.232 | 0.867 | 0.078 |
| Strs4 | 0.579 | 0.361 | −0.293 | 0.888 | 0.192 |
| Strs5 | 0.539 | 0.309 | −0.274 | 0.882 | 0.159 |
| Strs6 | 0.600 | 0.334 | −0.402 | 0.889 | 0.064 |
| Strs7 | 0.488 | 0.251 | −0.326 | 0.859 | 0.067 |
| UDSS2 | 0.275 | 0.449 | 0.273 | 0.117 | 0.934 |
| UDSS3 | 0.288 | 0.478 | 0.215 | 0.175 | 0.921 |
| UDSS4 | 0.289 | 0.515 | 0.188 | 0.169 | 0.910 |
| UDSS1 | 0.238 | 0.445 | 0.299 | 0.091 | 0.943 |
The bold values represent item loadings exceeding the recommended threshold of 0.5. Moreover, each item’s loadings on its respective variable consistently surpass all of its loadings on other variables, affirming the robustness of the measurement model.
Structural model evaluation
As previously considered, after the measurement models have been approved, the subsequent step involves the estimation of the structural model’s outcomes. This entails scrutinizing the model’s predictive capacities and the relationships among the dimensions, in accordance with the guidelines provided by Hair et al. (2021b). However, before delving into the assessment of the structural model, it is essential to consider the potential presence of collinearity within the structural model. In the context of PLS path modeling, the consideration of multicollinearity is crucial to ensure the validity of the results (Jagpal, 1982). To evaluate collinearity, several factors were examined. First, as depicted in Table 2, the tolerance levels were observed to be below the VIF (variance inflation factor) value of 5.00 for the predictor dimensions, indicating the absence of significant collinearity. Second, the significance of the estimates, third, the magnitude of the R2 scores, fourth, the f2 effect size, and, finally, the predictive relevance metrics, including Q2 and q2 effect sizes, were thoroughly assessed.
To assess the significance of the structural model’s paths, the PLS-SEM algorithm was employed. This algorithm estimates the path coefficients within the structural model, illustrating the hypothesized connections between the reflective factors. Additionally, the significance of these path coefficients was determined using the bootstrapping option with 5000 resamples. The results of hypothesis testing and structural relationships are presented in Table 5. Furthermore, the R2 values for the endogenous latent unobserved construct were computed using the PLS algorithm. For the endogenous latent construct, QOL, the R2 value is 0.609, with a Q2 value of 0.573, indicating a relatively high level of predictive accuracy. The magnitude of the R2 values serves as an indicator of predictive accuracy, while the Q2 value assesses the model’s predictive relevance. According to Hair et al., in SEM models, Q2 values >0 for a reflective endogenous construct signify the predictive relevance of the path model for that specific construct (utilizing cross-validated redundancy is recommended) (Hair et al., 2021a). The application of blindfolding procedures yielded a Q2 value significantly above zero, providing reinforcement for the model’s predictive power concerning QOL as an endogenous construct.
Hypothesis testing.
| Paths | β | STDEV | t-value | P | Decision |
|---|---|---|---|---|---|
| Depression → QOL | −0.319 | 0.065 | 4.884 | 0.000 | H1 is Supported |
| Anxiety → QOL | −0.184 | 0.075 | 2.456 | 0.014 | H2 is Supported |
| Stress → QOL | −0.133 | 0.064 | 2.062 | 0.040 | H3 is Supported |
| University disability service support → QOL | 0.579 | 0.043 | 13.527 | 0.000 | H4 is Supported |
| Moderating effects | |||||
| University disability service support × depression → QOL | 0.134 | 0.061 | 2.193 | 0.029 | H5 is Supported |
| University disability service support × stress → QOL | 0.128 | 0.056 | 2.294 | 0.022 | H6 is Supported |
| University disability service support × anxiety → QOL | 0.163 | 0.063 | 2.589 | 0.010 | H7 is Supported |
Abbreviations: QOL, quality of life; STDEV, standard deviation.
Hypotheses testing results
After confirming the validity of the outer model and assessing the goodness of the inner model, a total of seven hypotheses were evaluated. These encompassed four direct hypotheses and three moderating paths. The evaluation process involved the use of bootstrapping with 5000 repetitions to calculate critical parameters, including regression weights (β), t-values, and significance levels (P).
As demonstrated in Figure 2 and detailed in Table 5, the empirical findings derived from the PLS-SEM output substantiate Hypothesis 1 (H1). This hypothesis posited a negative relationship between depression, a dimension of RPMH, and QOL. The path analysis revealed a significant negative effect, with a path coefficient of −0.319, a t-statistic of 4.884, and a P value below 0.001. Similarly, Hypothesis 2 (H2), which proposed a negative impact of anxiety as another dimension of RPMH on the QOL of disabled students, garnered empirical support. The analysis yielded a significant negative effect, with a path coefficient of −0.184, a t-statistic of 2.456, and a P value below 0.05. Furthermore, Hypothesis 3 (H3) was upheld, indicating a negative and significant influence of stress, the third dimension of RPMH, on the QOL of disabled students. The path analysis resulted in a path coefficient of −0.133, a t-statistic of 2.062, and a P value below 0.05. On a different note, Hypothesis 4 (H4), which suggested a substantial positive impact of UDSS on QOL, found empirical validation. The path analysis revealed a high positive effect, with a path coefficient of 0.579, a t-statistic of 13.527, and a P value below 0.001.

In terms of the moderating analysis, the results obtained from the PLS-SEM output reveal that UDSS effectively mitigates and dampens (as depicted in Fig. 3) the negative impact of depression, anxiety, and stress (dimensions of RPMH disorders) on the DSQOL. These findings align with Hypotheses 5, 6, and 7. Specifically, for depression, the analysis showed a path coefficient of 0.134, a t-statistic of 2.193, and a P value below 0.05, indicating that UDSS plays a mitigating role in the relationship between depression and QOL. Likewise, in the case of anxiety, the path analysis revealed a path coefficient of 0.128, a t-statistic of 2.294, and a P value below 0.05, signifying that UDSS serves as a buffer against the negative impact of anxiety on QOL. Similarly, for stress, the results indicated a path coefficient of 0.163, a t-statistic of 2.589, and a P value below 0.05, affirming that UDSS dampens the adverse influence of stress on the QOL of disabled students. These outcomes are visually represented in Figure 3.

DISCUSSION
This study aims to understand the critical issues which affect how well university students with disabilities perform, both academically and mentally. The study investigates the main challenges and opportunities faced by college students with disabilities. This study, however, focuses on five elements of the relationships: (i) the direct connection between depression, UDSS, anxiety, stress and QOL; and (ii) the moderating consequence of UDSS in the expected relationship among anxiety, depression and stress on QOL.
This study’s findings corroborated with those of other studies that depression, academic achievement, and QOL are positively correlated (Barbosa-Camacho et al., 2022). Compared to their able-bodied classmates, disabled university students are more likely to experience depression. This is caused by a variety of causes, such as stigma and discrimination, scholastic difficulties, health issues, and financial difficulties (Marck et al., 2017). Students with disabilities often experience stigma and discrimination from their peers, teachers, and the public. Feelings of loneliness, isolation, and low self-esteem may result from this. Additionally, because of their condition, disabled kids could experience academic difficulties. Frustration and failure-related feelings may result from this.
It is crucial to recognize the nature of the connection between depression and QOL. Additional accountability variables, like social support, resource accessibility, and coping mechanisms, can be present for university-bound students with impairments. The findings do, however, indicate that depression poses a serious threat to the QOL of students with impairments. Much research is required to determine which buffering components, if any, may aid university students in improving their QOL over time.
The results of this investigation confirmed that anxiety had a direct impact on QOL. These outcomes come in line with different researches which show that students’ QOL is negatively impacted by anxiety. According to a recent study, anxiety has an optimistic direct effect on QOL, meaning that higher heights of anxiety are connected to lower QOL (Yuliana et al., 2023). Academic issues can result from anxiety since it can be difficult to focus and learn (Hakami et al., 2017). It may also result in social isolation, exhaustion, and a lack of vitality. In addition, the outcomes of the research also showed that anxiety significantly affects QOL. The findings of earlier research (Yuliana et al., 2023) support this result. In addition, anxiety can result in a variety of physical health issues, including headaches and muscle tension.
Our investigation and analysis find that stress has a negative direct impact on QOL. This result aligned with many authors’ findings that linked stress to university students with impairments’ effectiveness in the classroom (Damush et al., 1997). According to Yoo and Marshall (2022), stress can make it difficult to concentrate, affect memory and recall, and lower motivation. Additionally, it may cause physical symptoms like exhaustion, headaches, and stomachaches that make it challenging to attend courses and engage in educational activities.
The results of this study demonstrate that UDSS directly affects QOL. These findings support earlier research (Rath and Royer, 2002; Blasey et al., 2023) that demonstrates the importance of UDSS in enabling students with disabilities to achieve academically, interact socially, and have fulfilling lives. The findings also presented that UDSS meaningfully affects QOL. Therefore, our finding is supported by many previous studies. By raising awareness of the challenges faced by impaired students and working to foster a more inclusive campus environment, UDSS can play a bigger part in enhancing the QOL for impaired students.
This research adds and fills a gap in the existing literature by presenting novel findings. The study attempts to comprehend the UDSS’s moderating role in the link between major depression, stress, anxiety, and QOL. According to the current study’s findings, UDSS is crucial for improving the link between depression and QOL. A solitary, intermediate UDSS exercise yields a noteworthy influence on students’ capacity to incorporate scholarly notions and establish an improved educational milieu, wherein participants exhibit a heightened degree of physical self-confidence. The UDSS was found to greatly lessen depression. Furthermore, the study found that UDSS functions as a mediator in the relationship between anxiety and QOL. This suggests that when the UDSS in the university is functioning properly, the detrimental impact of anxiety on QOL is reduced. Furthermore, the study discovered that UDSS serves as a moderator in the link between stress and QOL. This suggests that good UDSS policy implementation aids in reducing the detrimental impact of anxiety on QOL.
CONCLUSION
The purpose of this study is to emphasize the expected influence of impaired students’ MH on their QOL in higher education. The study’s main goal is to figure out how the UDSS moderates the relationship between depression, anxiety, stress, and QOL. A quantitative approach was adopted, with data collected using a cross-sectional method. The study discovered negative relations between depression, anxiety, stress, and QOL. Furthermore, it showed that UDSS had a positive effect on QOL. The study highlighted that UDSS significantly buffered and dampened the negative influence of depression, anxiety, and stress on impaired students’ QOL.
Universities can offer programs and services to decrease the effect of depression and improve the QOL by integrating disabled students into work groups, as well as improving life skills through specialized programs. Universities can organize a variety of art exhibitions for their disabled students. They can also commemorate international days honoring people with disabilities, for example, World Disabilities Day. Creating databases for disabled students in Saudi universities will make it easier to reach them and aid in accurately identifying their needs. It will contribute to decision making regarding improvement and development, and it will help in raising the standard of living of students in Saudi universities.
The inclusion of students with disabilities in external community participation is essential. This can be achieved through their participation in programs developed by the Welfare Authority for Persons with Disabilities. Universities can also encourage them to enter the labor market by providing technical and financial support for the establishment of small-scale enterprises. In addition, universities can use the electronic marketing in order to promote these enterprises.
Universities can designate parking spaces, paving roads, and elevators to promote accessibility to university campuses. This can be done in order to achieve universal access and empowerment within the institution. Additionally, special counseling and a skill orientation program will be useful for students with impairments and their families. It is also recommended to conduct special meetings with specialists on a regular basis to discuss and resolve the issues confronting students with disabilities. The establishment of sports clubs, with a variety of specific equipment and instruments for disabled students, within universities can enhance the QOL.
IMPLICATIONS OF THE STUDY
This study carries a number of consequences, encompassing practical, academic, and economic implications. The study offers practical guidelines for decision-makers and policymakers within the realm of higher education. The Deanships of Students Affairs within universities ought to provide appropriate services and support for the students of the university, particularly those with disabilities. This has the potential to effectively minimize and manage the adverse impact of depression, anxiety, and stress on the students’ QOL. Moreover, these practices may also have an influence on academic performance and overall well-being. When disabled students are supported in accordance with their individual learning and physical requirements, this assists in mitigating any detrimental effects of daily depression, anxiety, and stress.
Students with disabilities can be incentivized to easily enter the job market upon graduation. If they experience less depression, anxiety, and stress, they will be able to derive satisfaction from their QOL. Consequently, their contributions to both the social and economic spheres will be positive.
The outcomes of our investigation aid decision-makers in controlling and alleviating the risk of experiencing heightened levels of depression, anxiety, and stress by providing professional services and support for disabled students. This will effectively reduce the overall indirect costs, such as absenteeism, withdrawal, and failure rates, associated with disabled students. As a result, their QOL will be consistently enhanced.