
INTRODUCTION
Malaria, a disease with an extensive and well-documented past, has origins dating back to antiquity. Allusions to what is thought to be malaria are evident in numerous historical records. These include a Chinese history from approximately 2700 BC, Mesopotamian clay tablets dating to 2000 BC, Egyptian papyri from 1570 BC, and Hindu texts as early as the sixth century BC. While these early references must be cautiously approached, as progress is made into later centuries, the picture becomes more apparent. Greek scholars such as Homer in 850 BC, Empedocles of Agrigentum around 550 BC, and Hippocrates in 400 BC recognized the health problems associated with living in marshy areas, including malarial fevers and enlarged spleens. For more than two and a half millennia, it was widely believed that malaria fevers were caused by toxic fumes emanating from swamps, and the word malaria is often attributed to the Italian “mal’aria,” meaning “spoiled air,” although this etymology remains disputed ( Cox, 2010).
The search for the cause of malaria gained momentum with Antoni van Leeuwenhoek’s discovery of bacteria in 1676 and the subsequent development of the germ theory of infection by Louis Pasteur and Robert Koch in 1878-1879. Scientific investigations into malaria became feasible after Charles Louis Alphonse Laveran discovered the parasites responsible for the disease in 1800. The role of mosquitoes as vectors for malaria was established by Ronald Ross in 1897 for avian malaria and by Italian scientists Giovanni Battista Grassi, Amico Bignami, Giuseppe Bastianelli, Angelo Celli, Camillo Golgi, and Ettore Marchiafava between 1898 and 1900 for human malaria ( Cox, 2010).
There is substantial circumstantial evidence to suggest that indigenous malaria, historically referred to as the “ague,” was prevalent in the United Kingdom. Originally, the term “ague” encompassed various acute fevers. Before the 14th century, epidemics were often labeled as agues or plague-agues, although contemporary descriptions imply that these may have been instances of typhus rather than malaria. By the 14th century, the term “ague” typically denoted tertian or quartan fevers, which occur every third or fourth day, coinciding with the tertian periodicity of Plasmodium ( vivax, ovale, and falciparum) infections, while Plasmodium malariae exhibited a quartan periodicity ( Chin and Welsby, 2004). Roughly 40% of the global populace faces the threat of malaria. The precise number of individuals contracting this illness remains uncertain, with approximations indicating that it affects between 350 and 500 million people annually. According to the WHO, Africa bears 59% of clinical malaria cases worldwide, Asia records 38%, and the Americas report just 3% ( Atta and Zamani, 2008).
Malaria typically manifests as an abrupt elevation in body temperature and results from an infection triggered by five unique types of unicellular protozoan parasites (specifically, falciparum, vivax, malariae, ovale, and knowlesi), all falling within the Plasmodium genus. Notably, Plasmodium knowlesi is responsible for zoonotic malaria and is primarily found in macaque monkeys within Southeast Asia, where it is sustained. These parasites are spread to people through the bites of infected female Anopheles mosquitoes. The presence of a significant multitude of pilgrims from diverse regions across the globe in Makkah may potentially contribute to the dissemination of the parasitic organism. The disease presents a two-part life cycle involving infection of the vertebrate host and transmission from the infected host to another via an insect vector ( NEWS Medical Life Sciences, 2023).
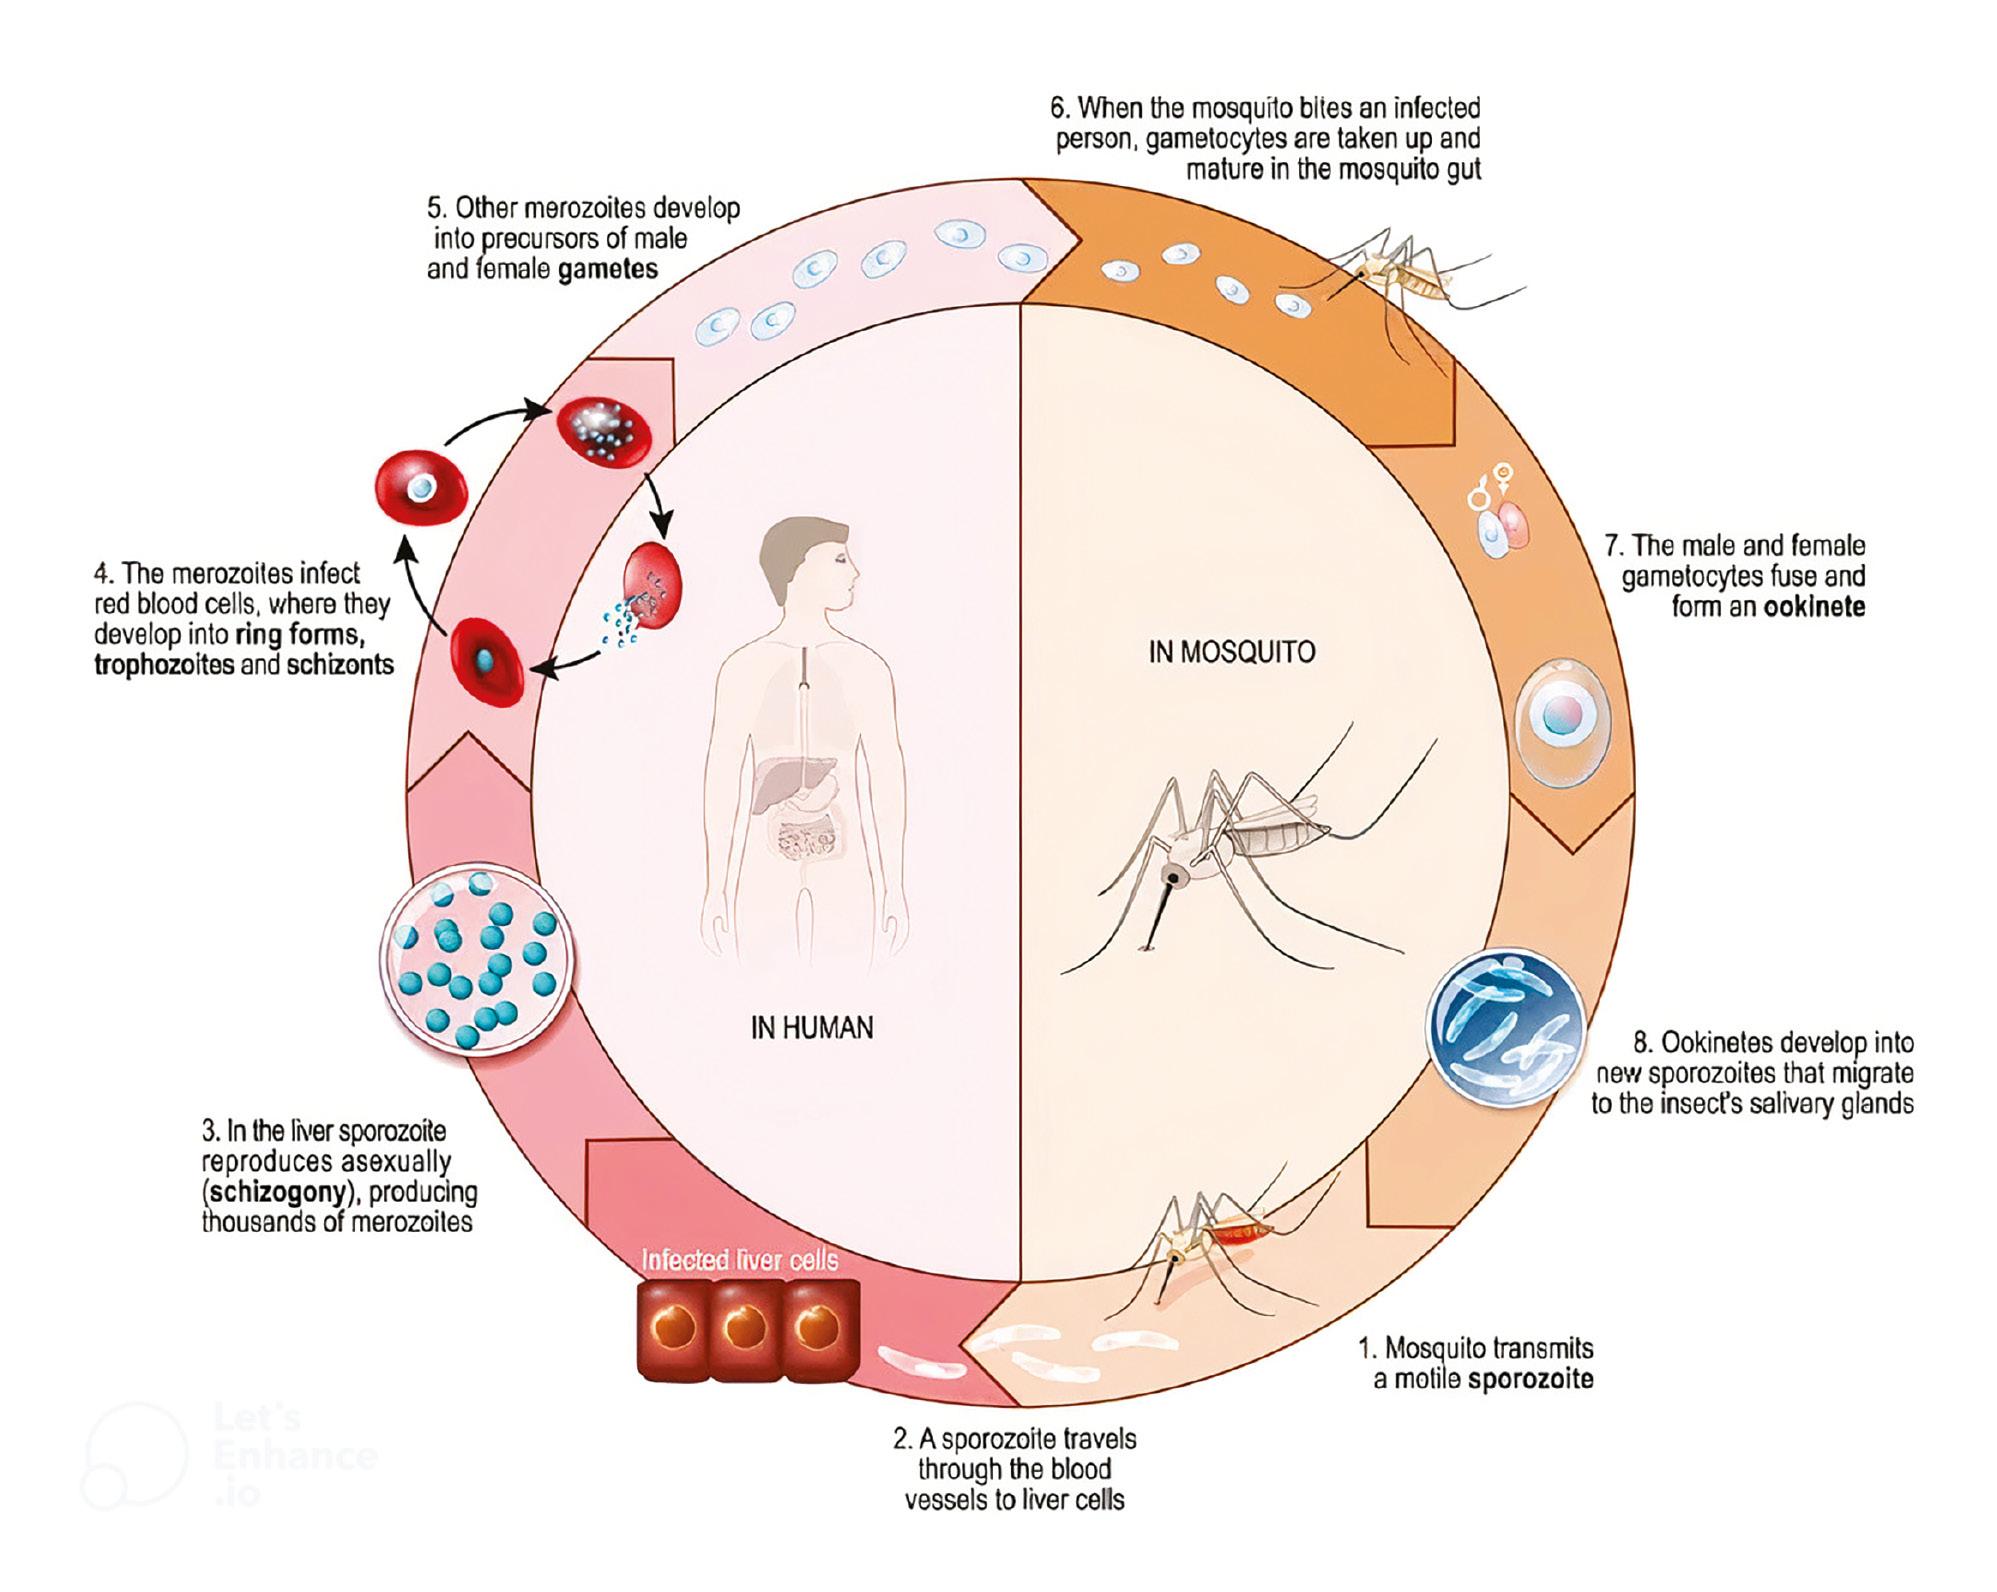
All Plasmodium species follow a consistent life cycle of two primary phases. The first phase initiates with the infection of a vertebrate host by sporozoites caused by a mosquito bite, leading to rapid multiplication in the liver and the subsequent release into the bloodstream, resulting in a continuous cycle of asexual reproduction. The second phase involves the transformation of specific merozoites into gametocytes, which mature in the bone marrow before being ingested by a mosquito. Fertilization and the formation of oocysts occur within the mosquito when the male and female gametes unite. These oocysts eventually release sporozoites that migrate to the mosquito’s salivary gland. Inoculation of these sporozoites into a new human host continues the malaria life cycle ( NEWS Medical Life Sciences, 2023), as illustrated in Figure 1.
Malaria presents a wide range of clinical manifestations, encompassing instances where symptoms are absent, yet the parasitic infection is detectable, to severe and potentially life-threatening conditions. Severe malaria is primarily distinguished by the detection of Plasmodium falciparum parasites in the bloodstream, alongside the emergence of clinical or laboratory indicators pointing to substantial impairment in essential organ function. Among African children, severe malaria predominantly encompasses severe malarial anemia, malaria associated with respiratory distress or metabolic acidosis, and malaria that leads to impaired consciousness or coma. It’s important to highlight that individuals who survive cerebral malaria, a form of severe malaria characterized by coma, often suffer from brain injuries, with approximately 25% of them experiencing long-term neurological and cognitive impairments ( Idro et al., 2016).
Malaria exhibits flu-like indications, commencing with fever, shivering, excessive perspiration, migraines, muscle discomfort, and weariness. The illness can advance to include chest discomfort, respiratory difficulties, a lingering cough, gastrointestinal issues such as diarrhea, nausea, and vomiting. In severe instances, it causes anemia and jaundice, and it may even trigger a life-threatening disease leading to unconsciousness called cerebral malaria. This ailment is accountable for about 15% of fatalities in children and nearly 20% of deaths in adults. Signs of the disease typically become apparent within 10 days to a month following a mosquito bite, and its intensity may fluctuate based on the specific parasite strain. Some individuals may not exhibit any indications for up to a year, as the parasites can remain inactive within the body. Particular forms of malaria can reoccur when parasites reemerge from the liver and reenter the bloodstream, causing the return of symptoms ( Cleveland Clinic, 2023).
Several models have been developed to comprehensively analyze the transmission dynamics of infectious diseases, reflecting ongoing efforts to enhance our understanding of disease spread and control ( Aslam et al., 2021; Hussain et al., 2021a, b; Alnahdi et al., 2022; Anjam et al., 2022; Abuasbeh et al., 2023; Meftah et al., 2023; Ramzan et al., 2023; Saleem et al., 2023; Sami et al., 2023). These models encompass a diverse array of methods, techniques, and intricacies, guided by the necessity for precise forecasts and efficient tactics in disease control. Erinle-Ibrahim Latifat et al. (2021) developed a mathematical model to investigate the transmission dynamics of malaria and its optimal control, but it lacks the visual presentation of the effectiveness of control measures. Gebremeskel and Krogstad (2015) also developed a mathematical model to analyze the transmission dynamics of malaria but did not provide its optimal control strategy.
An innovative model has been meticulously developed to delve into the intricate dynamics of malaria transmission, with the core aim of conducting a qualitative analysis. This study explores the essential attributes of the model, encompassing its positively invariant region, malaria-free equilibrium, parameter estimation, basic reproduction number, stability, and parameter sensitivity. Based on the sensitivity indices, optimal control strategies are meticulously designed, and the analysis provides valuable insights into the evolving effectiveness of these strategies over time, setting the study’s uniqueness apart.
MATHEMATICAL MODEL AND QUALITATIVE ANALYSIS
This section of the study introduces a model for the dynamics of malaria disease within a uniform population without implementing any control interventions. Examining this model aims to determine the impact of control measures in the subsequent model.
Development of the model
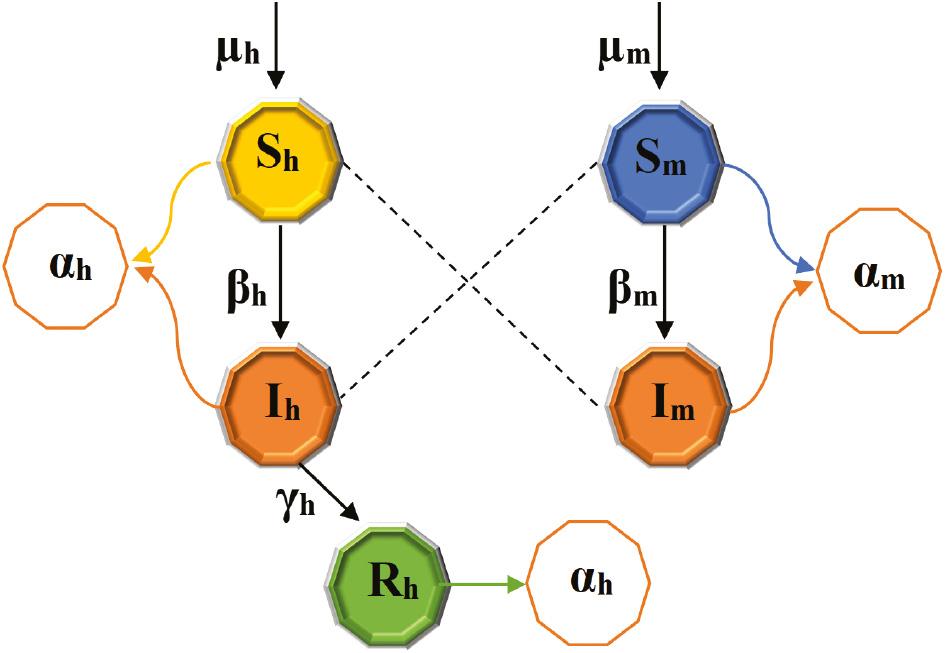
The model of malaria transmission considered in this study is an susceptible-infected-recovered (SIR) model for the human population and an susceptible-infected (SI) model for the mosquito population. The total population sizes of humans and mosquitoes are denoted by 𝔭 h ( t) and 𝔭 m ( t), respectively. The human population is further divided into categories, namely, susceptible S h ( t), infected I h ( t), and recovered R h ( t) individuals. Thus, the total human population is given by the following:
The mosquito population is divided into susceptible S m ( t) and infected I m ( t) groups, elucidated as follows:
It is important to note that the model does not include an immune class for mosquitoes since they do not recover from the infection, and their infectious period ends with their death due to their relatively short life cycle. Consequently, the presence of an immune class in the mosquito population is negligible, and death occurs uniformly across all groups. This model is applicable for diseases that persist in a population for an extended period and considers vital dynamics.
The basic model is based on a set of assumptions. First, it assumes that the total human population size remains constant. Additionally, individuals in the human population who recover from the infection develop permanent immunity. Newborn individuals are assumed to be susceptible to infection, and the development of malaria begins when an infectious female mosquito bites a human host. Furthermore, the data used for the human population in this model is based on real-world data, while for mosquitoes, it is assumed.
Individuals transition from one class to another as their disease status evolves. Humans enter the susceptible class through a birth rate denoted as μ h . Susceptible individuals become infected at a rate β h , which represents the rate of bite by an infectious mosquito that results in the transmission of the Plasmodium parasite to a human, and γ h is the rate at which individuals recover. α h is the natural death rate of humans. Mosquitoes enter the susceptible class at a rate μ m , and β m is the rate of mosquito bite resulting in the transmission of the Plasmodium parasite to a susceptible mosquito. α m is the natural death rate of mosquitoes.
Considering the assumptions mentioned above and the notations for variables and parameters, ordinary differential equations (ODEs) in system (1) that elucidate the dynamics of malaria within human and mosquito populations emerge, articulated in Figure 2.
All variables must remain nonnegative for times ≥0, representing the counts of humans and mosquitoes. The counts for both hosts and vectors can be expressed mathematically as follows:
The nonnegative invariant region for the system (1) is articulated as follows:
Malaria-free equilibrium and reproduction number ( R 0)
By assigning a value of 0 to the affected categories and their rate of change in the system (1), the equilibrium state of the model in which malaria is absent can be articulated as follows:
The basic reproduction number, denoted as R 0, is crucial in understanding malaria transmission. Its calculation relies on the utilization of the next-generation matrix technique. A comprehensive understanding of this method can be obtained by studying the principles detailed by Van den Driessche and Watmough (2002). The expression for R 0 can be elucidated as follows:
Stability analysis of the malaria-free equilibrium
The analysis of local stability for malaria-free equilibrium indicates the existence of short-term malaria dynamics, as documented in the literature ( Van den Driessche and Watmough, 2002; Collins and Govinder, 2016). To delve deeper into this phenomenon, the Jacobian matrix, denoted as ‘𝒥 0’, is computed for the model (1) while it is in the state of malaria-free equilibrium.
The eigenvalues are:
ℇ 1 and ℇ 2 reflect a negative trend, and when R 0 is less than 1, ℇ 3 and ℇ 4 also display negativity. The presence of negative eigenvalues suggests that the dynamics of malaria will wane gradually, ultimately leading to a stable, malaria-free state. Therefore, the subsequent theorems can be summarized as follows:
The malaria-free equilibrium point ℇ 0 of the model (1) exhibits local asymptotic stability when R 0 < 1, within the nonnegative invariant region ℜ.
The consequences of Theorem (2.1) are far-reaching, as they could potentially lead to the complete eradication of malaria. When the condition R 0 < 1 is met, and there exists a group of initially infected individuals in the vicinity of the malaria-free equilibrium (4), it becomes a plausible scenario to eliminate malaria from the entire population. However, in cases where R 0 > 1, malaria continues to persist.
The eradication of malaria poses a formidable challenge, irrespective of the initial number of infected individuals. Consequently, assessing the overall stability of the malaria-free equilibrium is a complex task. To address this challenge, the global stability results put forth by Castillo-Chavez et al. (2002) are used.
The malaria-free equilibrium point ℇ 0 of the model (1) exhibits global asymptotic stability when R 0 < 1, within the nonnegative invariant region ℜ.
To ensure the global asymptotic stability of the malaria-free equilibrium, it is imperative to validate the conditions presented by Castillo-Chavez et al. (2002), under the constraint that the basic reproduction number R 0, remains less than one. Within the framework of the system (1), the state variables are defined as 𝒳 1 = ( S h , S m ) and 𝒳 2 = ( I h , I m ). The malaria-free equilibrium is represented by . The solution for the linear system can be determined using the following approach:
which yields
The expressions presented above approach the limit of and as time t tends toward infinity. This holds true regardless of the initial values of S h (0) and S m (0). Consequently, the point is considered globally asymptotically stable. Furthermore, it is worth noting that.
Define 𝒞 and 𝒞𝒳 2 as follows:
The matrix denoted as 𝒞 contains nonnegative off-diagonal elements, classifying it as an ℳ-type matrix. This characteristic enables the computation of through the expression 𝒞𝒳 2 − 𝒢.
It is apparent that the expression possesses the quality of nonnegativity, subject to the conditions 0 ≤ S h ≤ 𝔭 h and 0 ≤ S m ≤ 𝔭 m . The epidemiological consequence of this result is that malaria will be eradicated from the community, irrespective of the initial population of infected individuals, provided that R 0 < 1.
Outbreak growth rate
If R 0 > 1, the malaria-free equilibrium experiences instability, increasing the likelihood of a disease outbreak within the population. The eigenvalues of the Jacobian matrix at the malaria-free equilibrium is commonly referred to as the initial outbreak growth rate ( Ma and Earn, 2006; Tien and Earn, 2010). The eigenvalues of the Jacobian matrix for model (1) evaluated at the malaria-free equilibrium point are articulated in Equation (7). As ℇ 3 > 0 for R 0 > 1, this implies that a higher value of ℇ 3 corresponds to a more severe disease outbreak. In the absence of interventions to control the transmission of infection, there is a high likelihood that an outbreak will spread to the entire population and will grow at a rate of ℇ 3.
MODEL FITTING AND PARAMETER ESTIMATION
Model fitting and parameter estimation are essential processes for data analysis, playing a pivotal role in identifying the most appropriate mathematical model for a given dataset and determining the parameter values that minimize the disparity between the model’s predictions and the observed data. These processes encompass several key steps, including model selection, parameter initialization, iterative optimization, validation, ensuring convergence, and interpreting parameter estimates. They are widely applicable across various domains, enabling researchers to develop and refine models, make predictions, and gain valuable insights into complex phenomena.
To illustrate the practical application of these processes, parameters are estimated by analyzing real-world data on annual malaria cases in the United Kingdom from 2002 to 2021, as documented in GOV.UK (2023). The data used for the human population in this model are based on real-world data, while for mosquitoes, it is assumed. The average life expectancy during this period in the United Kingdom was reported as 80.19 in Macrotrends (2023). It’s worth noting that this model can be applied to specific data on the annual, monthly, or daily incidence of malaria cases in any country. Figure 3 compares the actual and estimated numbers of confirmed malaria cases in the United Kingdom, revealing a strong correspondence between the estimated and actual cases. Parameter estimation results derived from the real-world data are presented in Table 1.
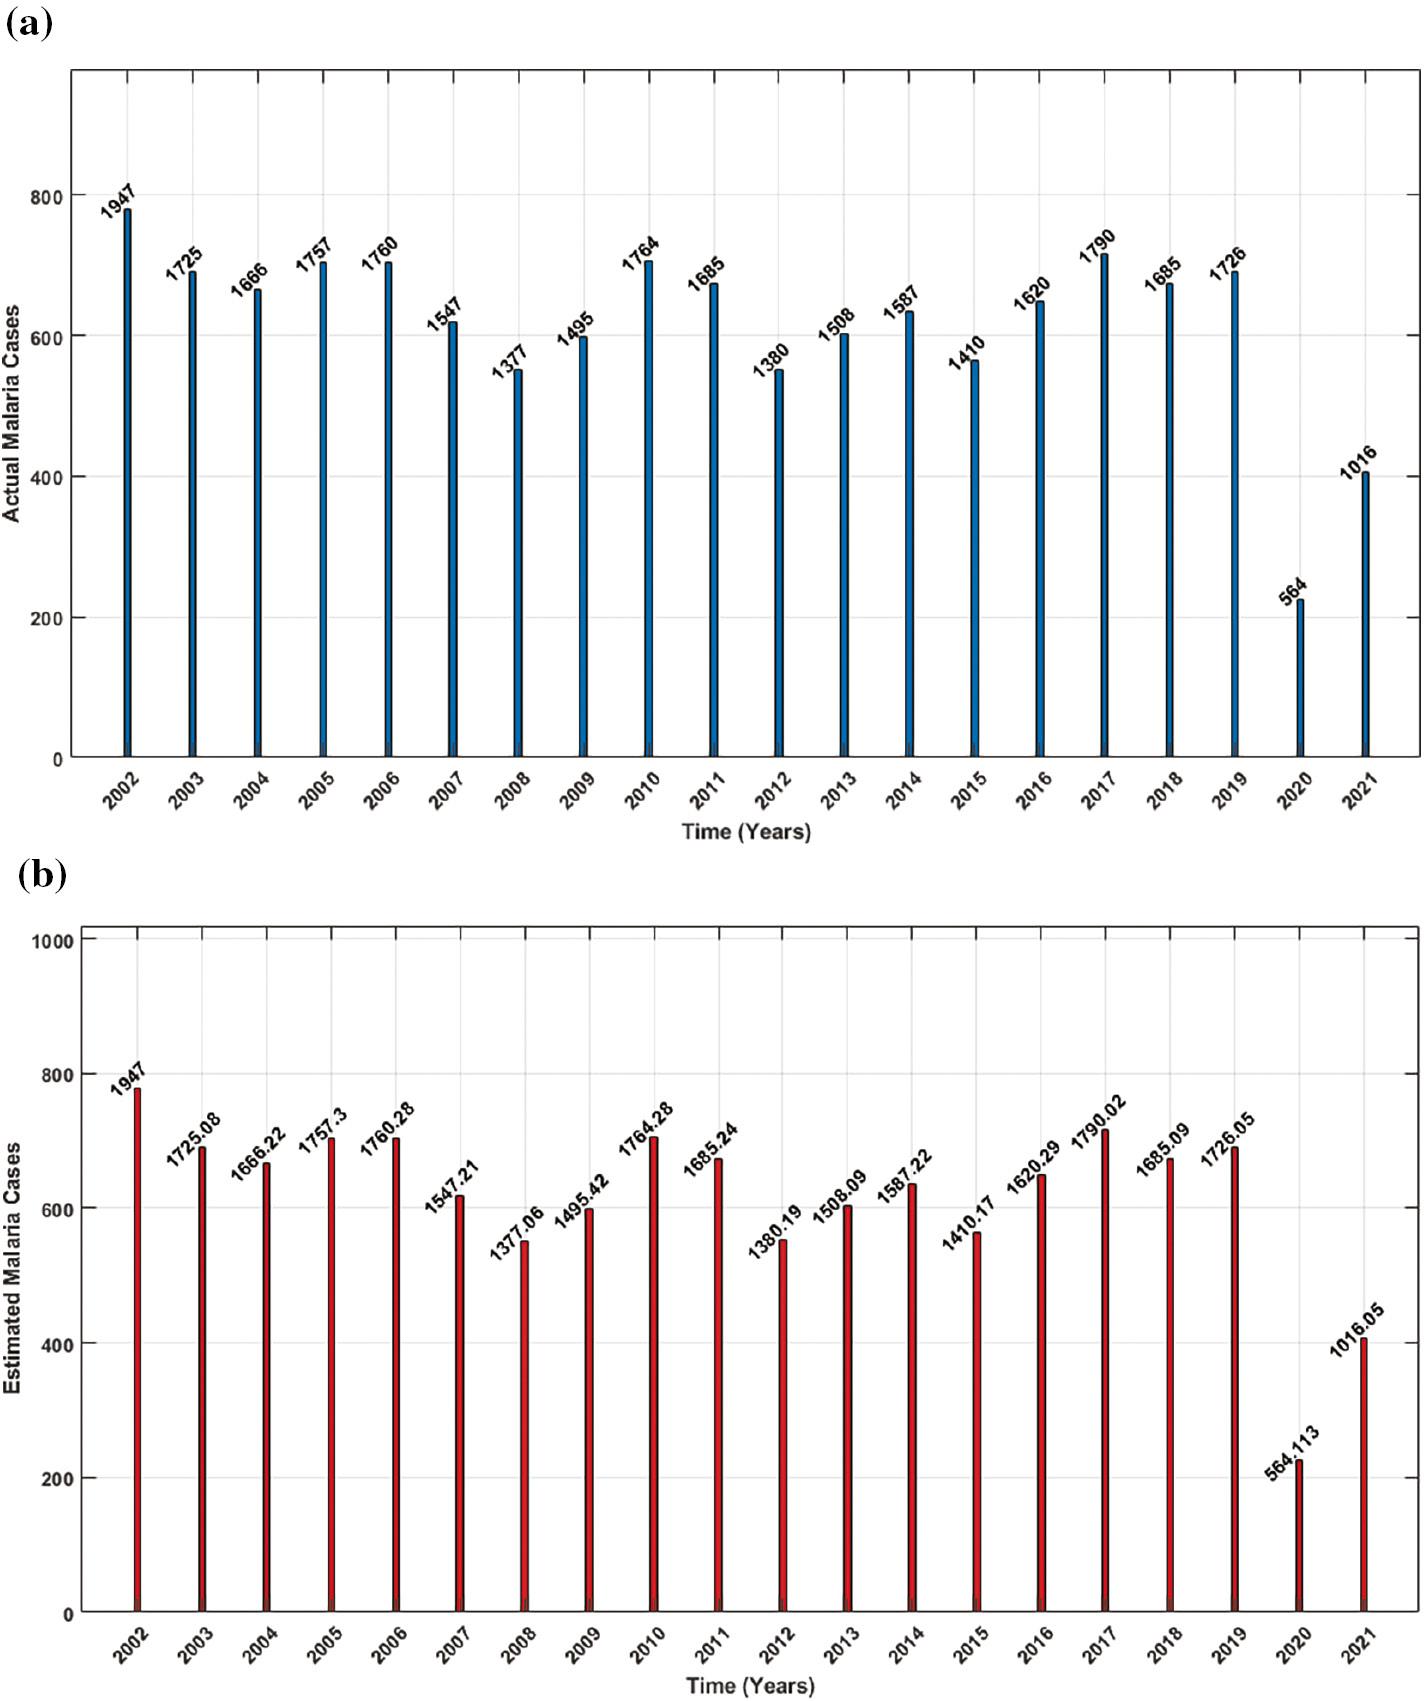
Comparison of the actual and estimated cases of malaria, showing that estimated cases closely match the actual cases: ( a) actual malaria cases, ( b) estimated malaria cases.
Parameter values for the malaria transmission model (1).
| Notations | Values | Description | Source |
|---|---|---|---|
| μ h | 1,165,900 | Average human birth rate per year | Macrotrends (2023), Macrotrends (nd) |
| β h | 1.0 × 10 5 | The rate of Plasmodium transmission to a susceptible individual | Fitted |
| γ h | [0.2885, 0.8749] | The rate at which individual recovers | Fitted |
| α h | 0.012470383 | The natural death rate of humans | Macrotrends (2023) |
| μ m | 100000 | The birth rate of mosquitoes | Assumed |
| β m | 5.0 × 10 −4 | The rate of Plasmodium transmission to a susceptible mosquito | Fitted |
| α m | [0.1, 0.25] | The natural mortality rate of mosquitoes | Assumed |
An analysis is conducted using data on the annual incidence of malaria cases to determine the transmission rate of the Plasmodium parasite in humans through mosquito bites. The results indicate that the reproduction number for malaria transmission falls from 1.45162 to 3.94107.
SENSITIVITY ANALYSIS
Sensitivity analysis is crucial for understanding how changes in model parameters and initial conditions impact outcomes. It allows us to validate our models, guide parameter estimation, quantify uncertainties, identify critical parameters, optimize experiments, and uncover the hidden mechanisms behind complex biological systems.
Sensitivity indices
Sensitivity indices offer a way to mathematically gauge how changes in parameters affect the fluctuations in a particular state variable. The mathematical formula to express the sensitivity indices utilized by Chitnis et al. (2008) is as follows:
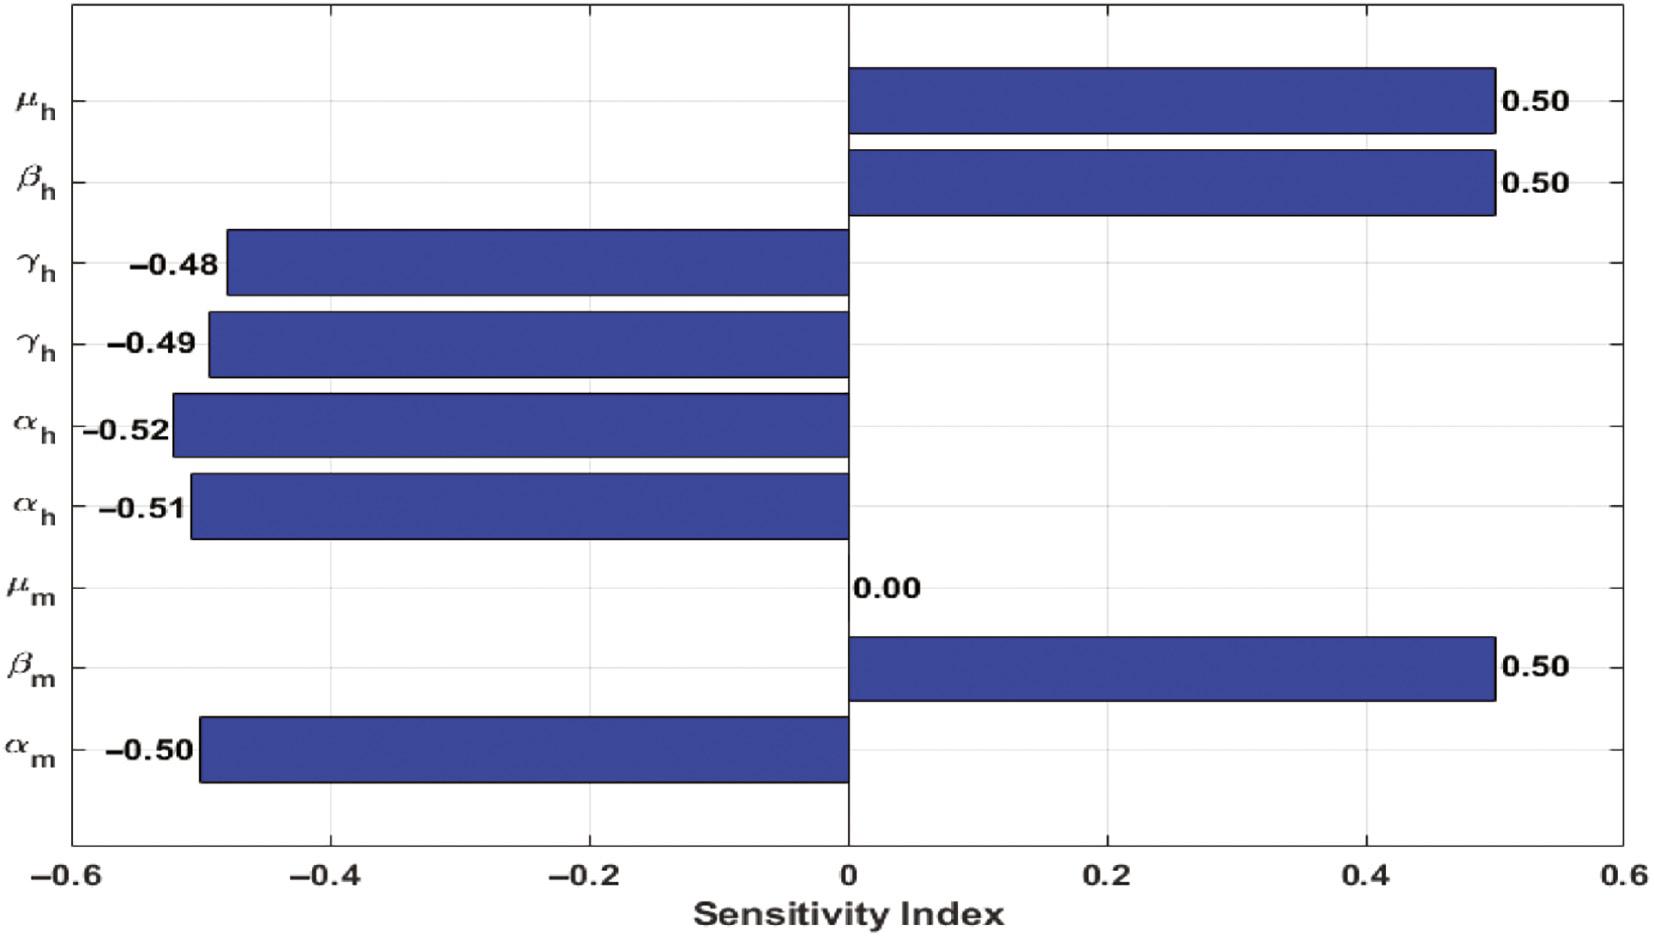
After analyzing the data in Table 2, a distinct pattern emerges, demonstrating that Plasmodium transmission exhibits an upward trend as the values of the parameters μ h , β h , and β m increase, while Plasmodium transmission displays an inverse relationship with the negative values attributed to the parameters γ h , α h , and α m . Visual representations of these observations are provided in Figure 4.
Sensitivity indices of R 0 parameters.
| Parameters | Description | Sensitivity index | Sign |
|---|---|---|---|
| μ h | Average human birth rate per year | 0.5 | +ve |
| β h | The rate of Plasmodium transmission to a susceptible individual | 0.5 | +ve |
| γ h | The rate at which individual recovers | [−0.49297, −0.47928] | −ve |
| α h | The natural death rate of humans | [−0.52072, −0.50703] | −ve |
| μ m | The birth rate of mosquitoes | 0 | - |
| β m | The rate of Plasmodium transmission to a susceptible mosquito | 0.5 | +ve |
| α m | The natural mortality rate of mosquitoes | −0.5 | −ve |
It’s important to understand that every nonnegative sensitivity index derived through sensitivity analysis plays a direct role in determining the disease threshold quantity, while negative indicators lead to the opposite effect. This sensitivity analysis highlights just how influential the parameters controlling the transmission of Plasmodium parasite in humans and mosquitoes, referred to as β h and β m , are about the disease’s basic reproduction number, R 0. On the flip side, the parameter γ h , which represents the recovery rate in humans and the natural death rates of both humans and mosquitoes, denoted by α h and α m , exhibit an inverse relationship with the value of R 0.
Parameters’ impact on R 0’s sensitivity spectrum
In infectious disease modeling, understanding the sensitivity of the basic reproduction number to various parameters is crucial. This analysis explores the intricate relationship between key parameters and the sensitivity spectrum of R 0. By visualizing this impact through 3D graphs depicted in Figure 5, this study aims to unravel the underlying dynamics of disease transmission and shed light on the parameter-driven changes in R 0.

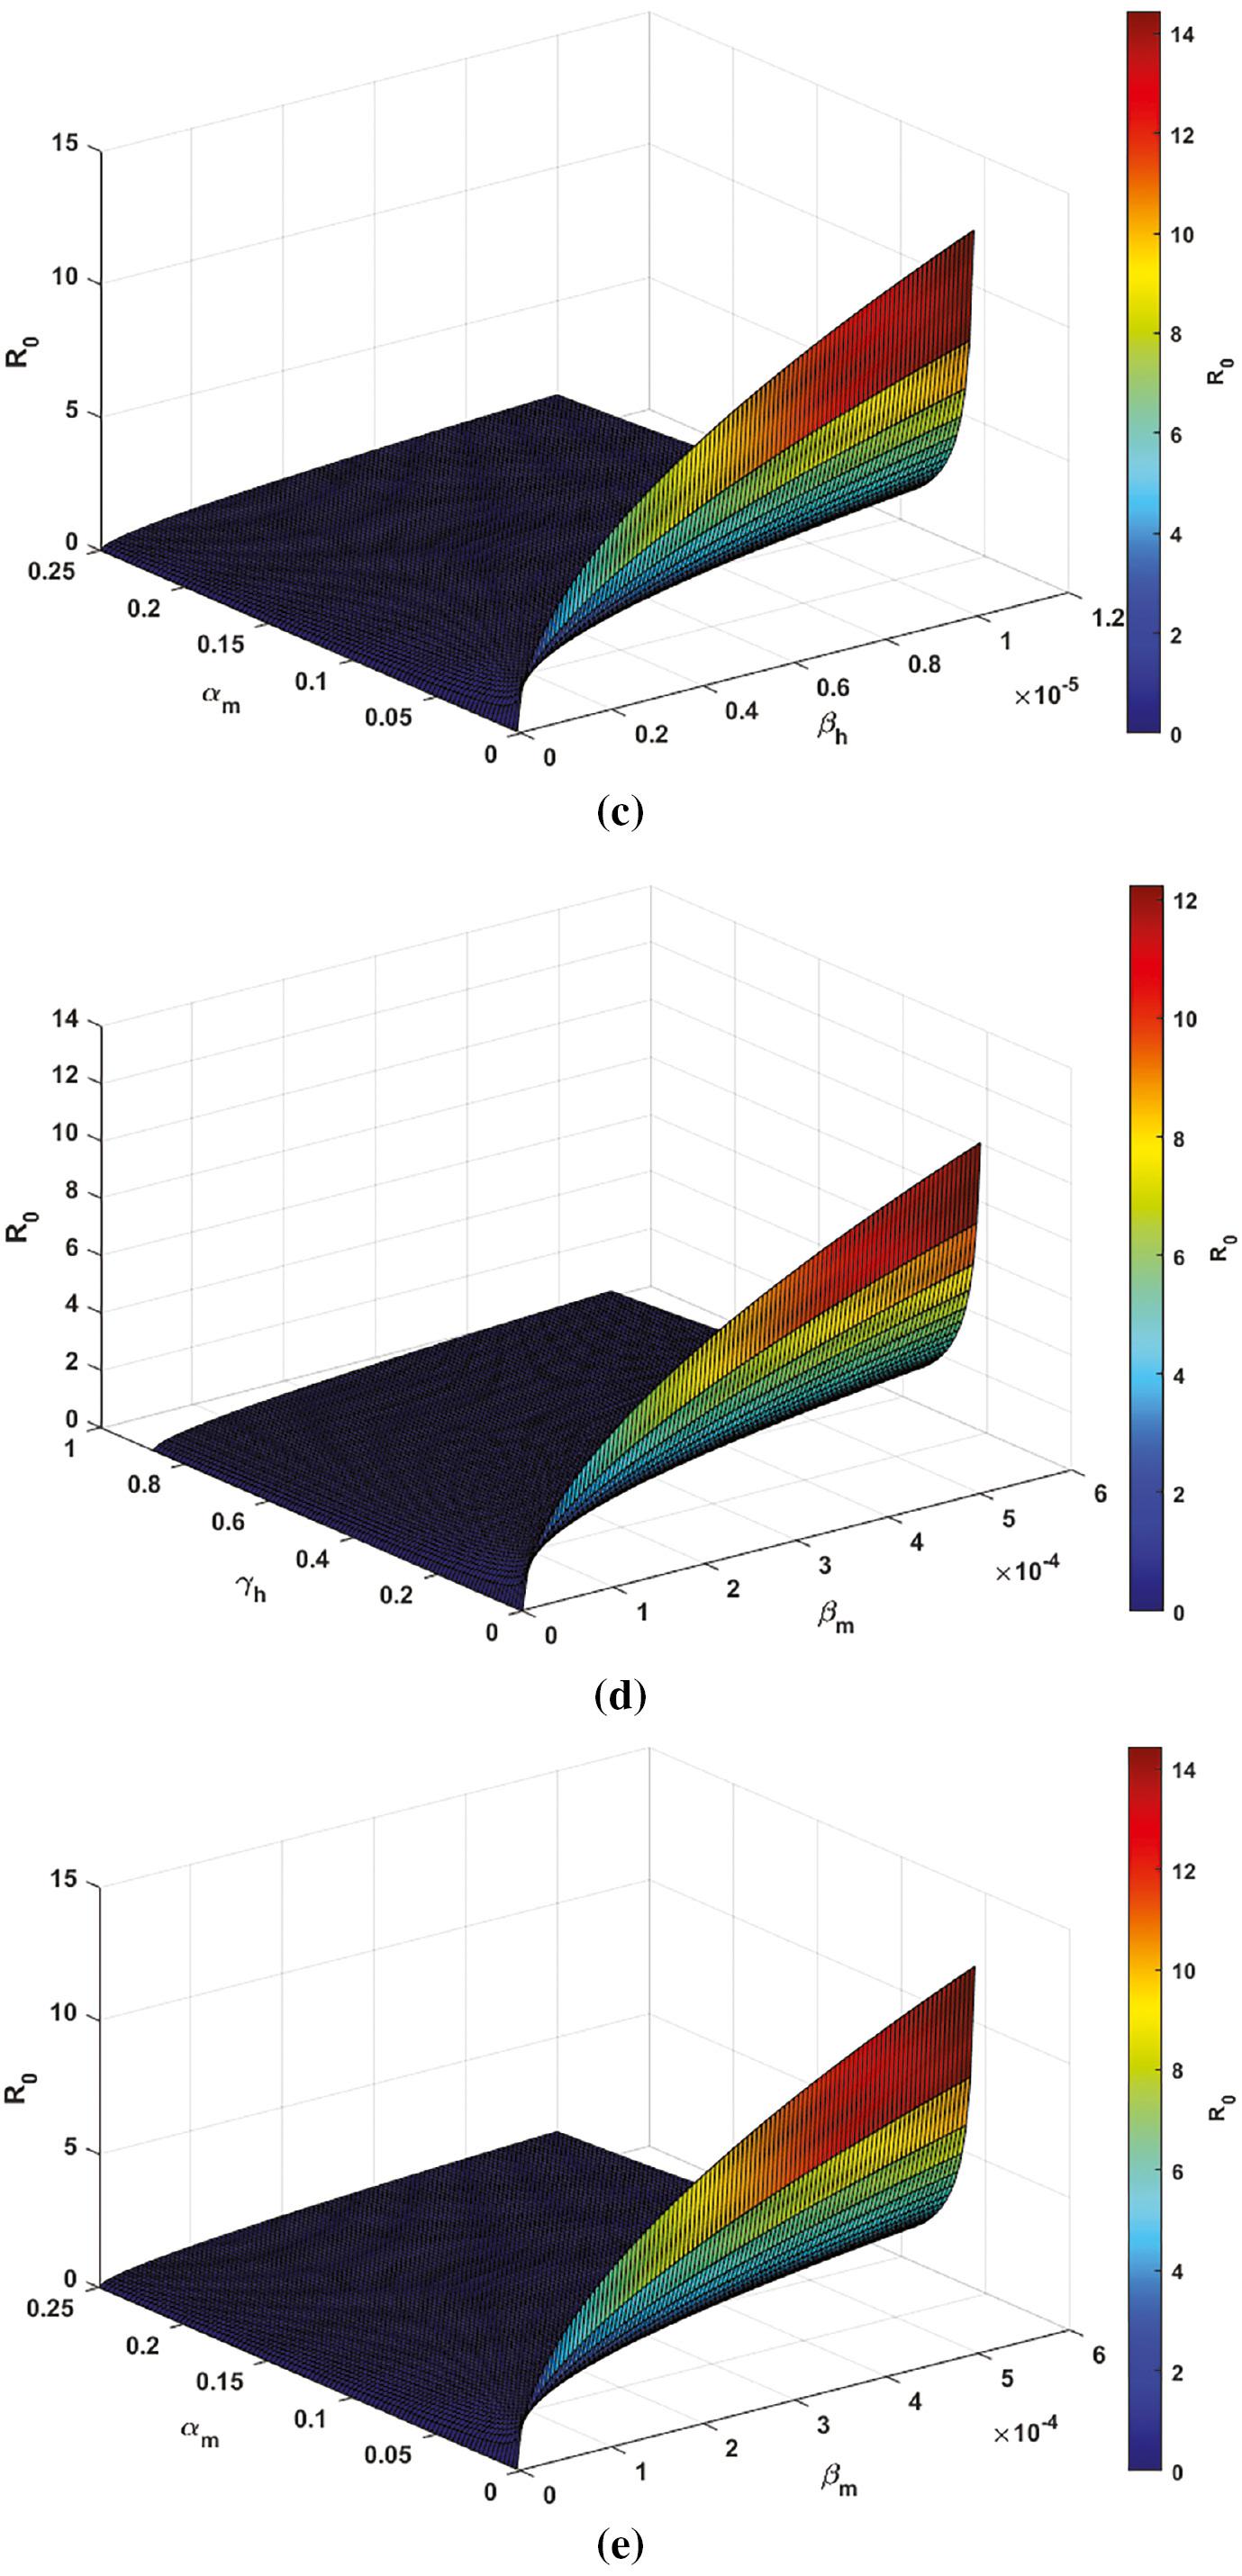
Visualization of Parameters Impact on R 0 via 3D Plot; ( a) R 0 vs. β h and β m ; ( b) R 0 vs. β h and γ h ; ( c) R 0 vs. β h and α m ; ( d) R 0 vs. β m and γ h ; and ( e) R 0 vs. β m and α m .
In Figure 5a, a visual representation is provided to illustrate the impact of the rate of Plasmodium parasite transmission to a susceptible individual, denoted as β h , and the rate of Plasmodium parasite transmission to a susceptible mosquito, denoted as β m , on the value of R 0. The results emphasize the critical importance of reducing the rate of Plasmodium parasite transmission to a susceptible individual to a level lower than 1.0 × 10 −5 while simultaneously ensuring that the likelihood of Plasmodium transmission to a susceptible mosquito remains below 0.000237281 to maintain R 0 < 1.
Figure 5b depicts how variations in two crucial factors, the Plasmodium parasite transmission rate to a susceptible individual β h and the human recovery rate γ h , impact R 0. The data show that to maintain R 0 < 1, it is vital to reduce β h to below 1.0 × 10 −5 and increase γ h above 1.8574.
Figure 5c presents insights into the parameter values necessary to keep R 0 < 1. Effective control strategies should involve decreasing β h and increasing mosquito mortality α m to achieve this. Any increase in Plasmodium parasite transmission directly raises R 0. To ensure R 0 < 1, it is essential to reduce β h below 4.74563 × 10 −6 and increase α m above 0.25.
Figure 5d illustrates how variations in Plasmodium parasite transmission rate to a susceptible mosquito β m and human infection recovery rate γ h affect R 0. The data demonstrate that to maintain R 0 < 1, it is crucial to reduce β m to below 5.0 × 10 −4 and increase γ h above 1.8574.
Figure 5e provides insights into the parameter values needed to keep R 0 < 1. Effective control strategies should involve reducing β m and increasing mosquito mortality α m to achieve this. Any increase in Plasmodium parasite transmission raises R 0. To ensure R 0 < 1, it is essential to reduce β m below 0.000237281 and increase α m above 0.25.
These findings underscore the importance of addressing the transmission rate in controlling Plasmodium parasite transmission within the community. Single transmission rate alterations alone won’t effectively lower R 0. To significantly reduce it, comprehensive control strategies addressing all transmission rate are essential.
OPTIMAL CONTROL
Optimal control theory provides a valuable framework for optimizing processes in biological systems. This section delves into the application of optimal control theory to a specific biological model referred to as (1). To enhance comprehension and establish control over the system, four time-dependent control variables, denoted as 𝒳 1, 𝒳 2, 𝒳 3, and 𝒳 4, are added. The model represented as (8) delineates the dynamics of a biological system, encompassing the temporal evolution of various variables. This model forms the foundation for optimization efforts.
The variable 𝒳 1 plays a pivotal role as a critical control parameter, vital for effectively mitigating malaria transmission to the susceptible human population. Its profound influence extends across a broad spectrum of multifaceted initiatives, including bed net promotion, prophylactic medication (involving the use of anti-malarial drugs to prevent infection in individuals residing in or traveling to malaria-endemic regions) ( Bannister, 2007), indoor spraying, and health education. These measures collectively ensure comprehensive protection and raise awareness among susceptible individuals, forming a robust defense against malaria.
The control variable 𝒳 2 harnesses a range of nanotechnologies for advanced malaria control. Prioritizing accurate diagnosis, plasmonic nanostructures enhance diagnostic precision ( Cho et al., 2014), DNA aptamers integrated within DNA origami scaffolds offer innovative possibilities ( Godonoga et al., 2016), and nanomechanical assays swiftly detect immune responses triggered by malaria vaccines ( Brunetti et al., 2021). Surface-enhanced Raman spectroscopy nanorattles and magnetic beads facilitate malaria DNA detection and genotyping ( Ngo et al., 2016). Moving on to treatment, targeted drug-delivery systems using nanoparticles improve effectiveness while minimizing side effects ( Puttappa et al., 2019). Nanotechnology-based carriers enhance drug selectivity, and nano-based drug-delivery systems enhance malaria treatment efficacy, particularly for severe cerebral malaria ( Santos-Magalhães and Mosqueira, 2010). Additionally, noninvasive, rapid transdermal malaria detection is achieved using laser pulses, and a cost-effective device allows noninvasive malaria diagnosis in both humans and infected Anopheles mosquitoes without the need for blood sampling or reagents ( Lukianova-Hleb et al., 2013).
The variable represented by 𝒳 3 and 𝒳 4 collaborate on a comprehensive approach to eliminate mosquito populations and repel them from residential areas, emphasizing advanced devices, nanotechnology, and laser-based photothermal methods with nanoparticles for human and environmentally safe pathogen carrier detection and elimination ( Foster et al., 2014). Silver nanoparticles, sourced from materials like Acacia caesia and Aganosma cymosa leaf extracts, effectively target mosquito vectors and their eggs or larvae, providing eco-friendly solutions ( Benelli and Govindarajan, 2016; Benelli et al., 2018). Various nanomaterials, including silver, gold, zinc, cobalt, and copper, show promise as nontoxic, selective mosquito control agents, particularly against Anopheles stephensi, the malaria vector ( Ray and Bhattacharya, 2020).
Based on the descriptions provided earlier, it is possible to develop an optimal control model for malaria, which comprises four time-dependent variables as detailed below:
By integrating the four control measures, the central aim is to reduce malaria transmission within the community, ultimately leading to a decrease in the mosquito population. The overarching objective is to accomplish this while ensuring cost-effectiveness. To achieve this goal, an objective functional is defined as articulated below:
Consider t as the duration for which controls are executed within the time interval [0, t], and ℬ n ( n = 1,…,4) denotes constants indicating the total expenses associated with control parameters 𝒳 n ( n = 1,…,4). The current challenge is centered on an optimization objective. The cost-control functions exhibit a quadratic form, where accounts for expenses related to awareness initiatives and precautions for susceptible human individuals, deals with the cost of diagnosing and treating malaria in individuals using advanced nanotechnology, and and pertain to costs associated with the removal and repelling of mosquito populations in malaria-endemic regions. The objective is to identify the optimal set of control parameters that effectively reduces the overall incurred cost.
A set of control variables is elucidated as follows:
Pontryagin’s maximum principle is utilized to transform the task of minimizing control within the context of an optimal control system (8) into a more specific issue of minimizing the Hamiltonian. This transformation has been analyzed in the study by Pontryagin (1987), where the associated Hamiltonian function E is elucidated as follows:
The symbols Λ n (for n = 1,…,5) represent the adjoint variables associated with the system (8). Likewise, ℛ n (for n = 1,…,5) denotes the expressions on the right-hand side of the ODEs managing the system’s (8) state variables. The Hamiltonian can be articulated as follows:
Where 𝔭 m = S m + I m .
The forthcoming theorem outlines the most effective strategy, denoted as 𝒳 *, to achieve the goal of minimizing the problem (10). It is important to emphasize that the methodology employed in this context is based on the principles and techniques discussed in prior studies, specifically Fleming and Rishel (2012) and Adepoju and Olaniyi (2021).
If there are variables that satisfy (10) w.r.t the system (8), then there exists a collection of functions Λ 1(t), Λ 2(t),…Λ 5(t) that satisfy the subsequent system of equations:
Under the transversion constraints, where all Λ n(t) = 0 ∀ n = 1, 2,…,5, the solution for the best control parameters, denoted as the quintuplet , is as follows:
By applying the approach described by Fleming and Rishel (2012), one can ascertain the boundaries for achieving an optimal control resolution by utilizing Pontryagin’s maximum principle. This process involves the examination of the following criteria:
By following the given transversion constraints, which state that Λ n ( t f ) = 0 for all n = 1, 2,…,5, the expression for the behavior of the control variables is as follows:
Analyzing the control parameters involves constraining their values through well-reasoned arguments, ensuring that …
where
The proof is now finalized.
Control efficiency through visual graphics
The problem is solved using numerical methods and then the effectiveness of the implemented controls is evaluated. The optimal campaign is designed to span 20 years and utilize the values provided in Table 2. Considering positive weights: 𝒜 1 = 1, 𝒜 2 = 3, 𝒜 3 = 5, 𝒜 4 = 7, 𝒜 5 = 9, and ℬ 1 = 1, ℬ 2 = 2, ℬ 3 = 3, ℬ 4 = 4. The initial conditions are set as follows: S h (0) = 93493523, I h (0) = 1947, R h (0) = 3000, S m (0) = 500000, I m (0) = 10000.
By incorporating all controls, the aim is to minimize the number of infected individuals and boost the recovery of individuals, which is depicted through visual representations.
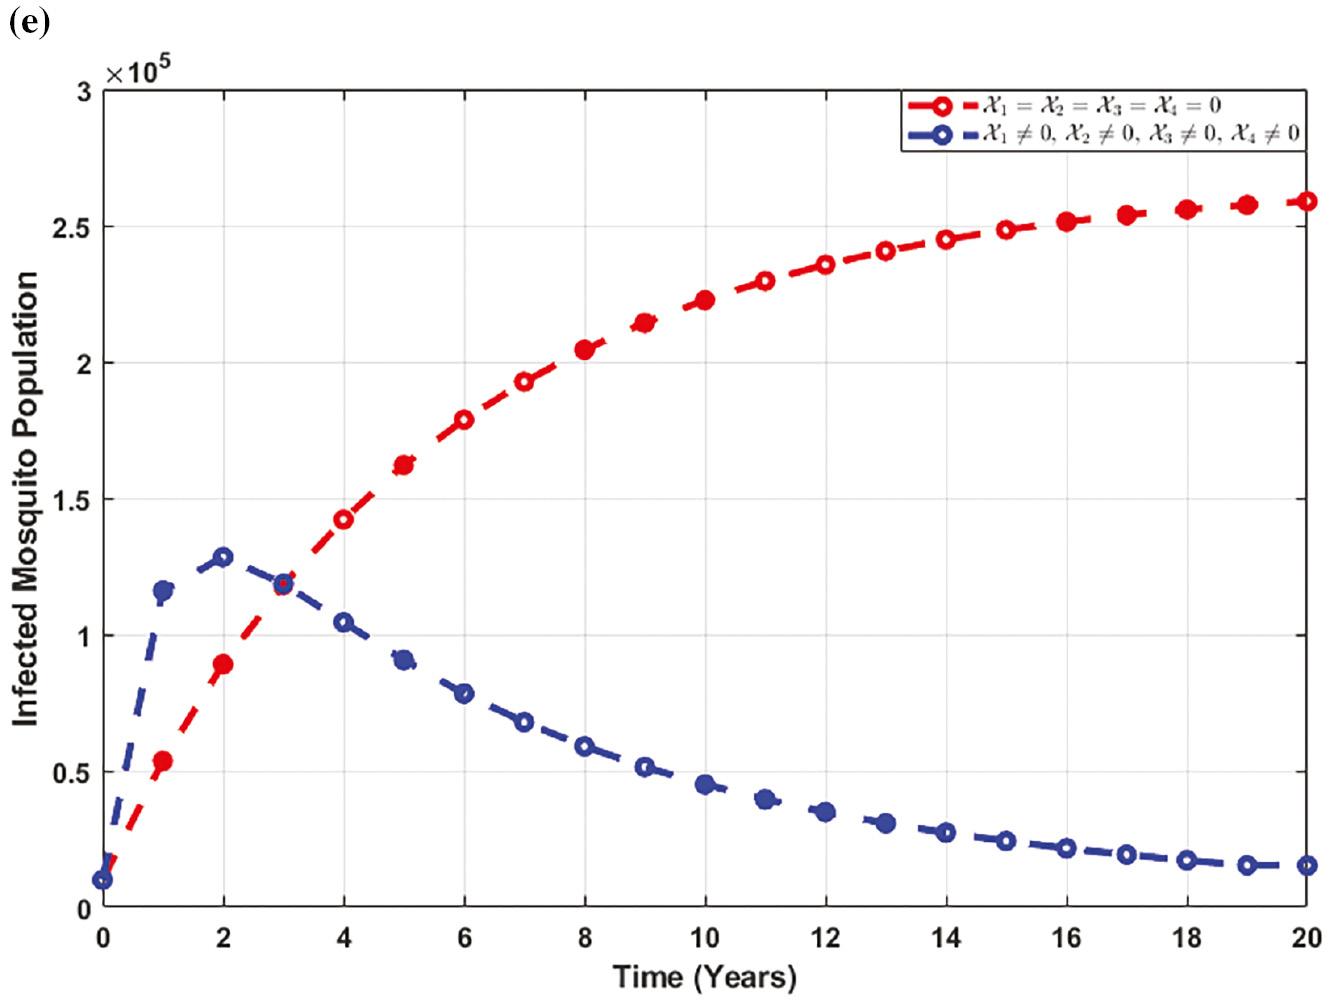
For minimum estimated parameter values
Figure 6 depicts the optimal control strategy implemented when the minimum values of the estimated parameters are considered.


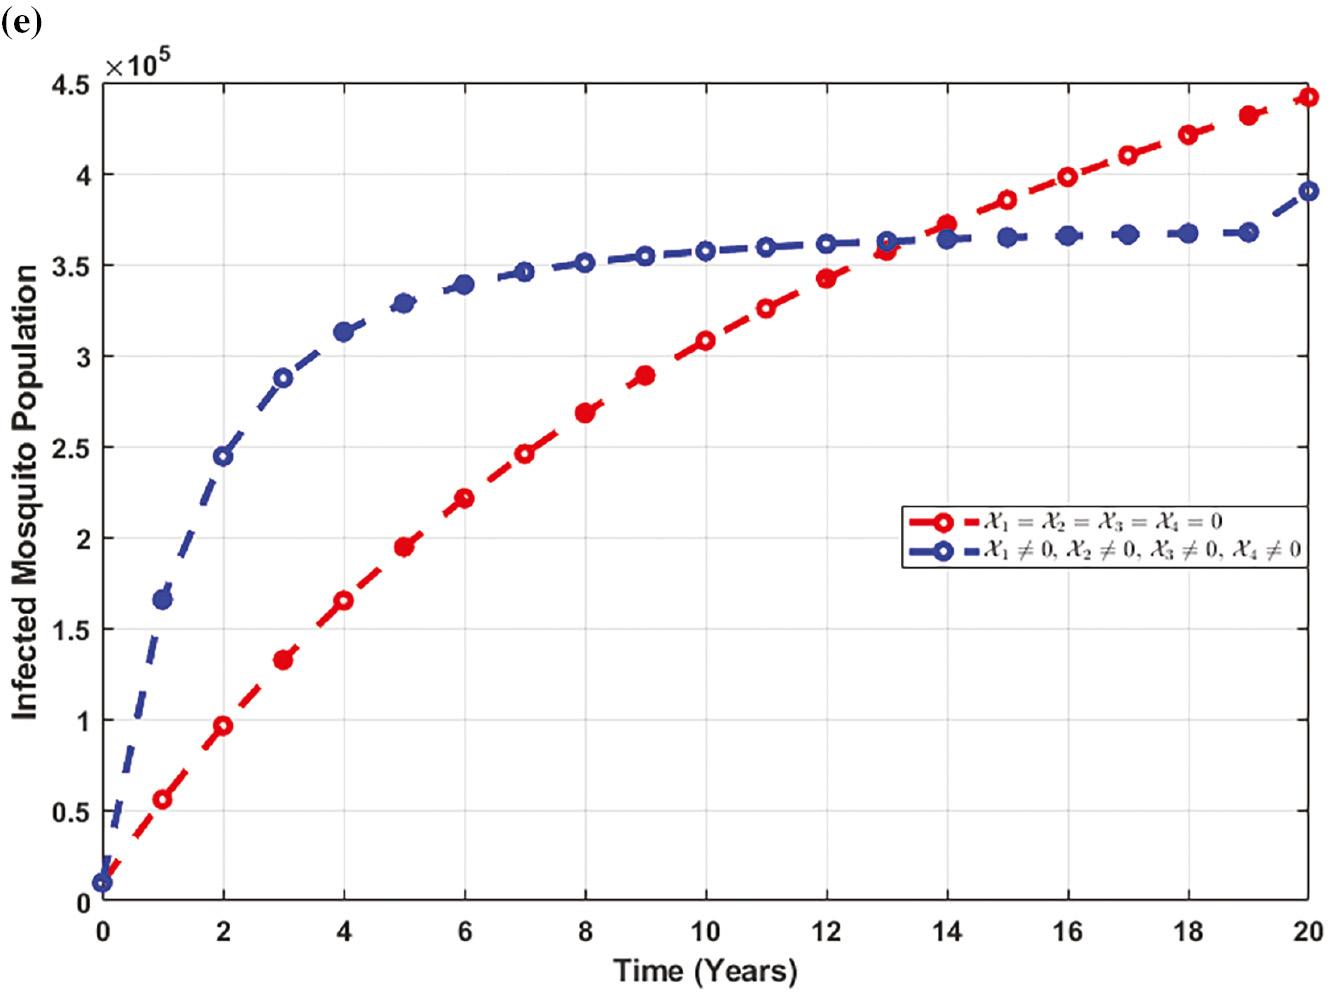
Figure 6a confirms that the implementation of preventive measures leads to a shift in the demographic of potential infection, favoring individuals who have already been infected or have recovered. Consequently, this shift contributes to a reduction in the count of individuals who remain susceptible to the disease.
Figure 6b depicts a noticeable reduction in the number of people infected with the disease, evident after control interventions have been applied.
Figure 6c demonstrates that there is a significant rise in the number of individuals who have successfully recovered from the illness, showcasing the effectiveness of the implemented control strategies.
Figure 6d portrays a decrease in the population of susceptible mosquitoes following the implementation of control strategies. This suggests that these mosquitoes are either being removed from the community or transitioning to the group of infected mosquitoes.
Figure 6e elucidates that there is an initial increase in the number of mosquitoes infected with the disease upon the initiation of control strategies. However, over time, the population of infected mosquitoes starts to decrease.
For maximum estimated parameter values
Figure 7 depicts the optimal control strategy implemented when the maximum values of the estimated parameters are considered.
Figure 7a demonstrates that when preventive measures are applied, the susceptible human population transitions to the infected and recovered compartments, resulting in a decrease in the susceptible population.
Figure 7b shows a significant decline in the infected human population following the application of control interventions.
Figure 7c highlights a significant increase in the count of individuals recovering from the infection following the implementation of control strategies.
Figure 7d illustrates a decrease in the susceptible mosquito population upon implementing control strategies, suggesting that these mosquitoes are either being removed from the community or transitioning to the infected compartment.
Figure 7e reveals an initial increase in the infected mosquito population upon implementing control strategies. However, eventually, this is followed by a significant decrease, indicating the effectiveness of the control measures.


Control profile
A control profile is a customizable configuration that defines the efficiency of control strategies. It allows policymakers to adapt their specific preferences or requirements, enhancing their experience and efficiency in disease control. Figure 8 illustrates the effectiveness of various disease control measures and how the efficacy of each control method evolves.
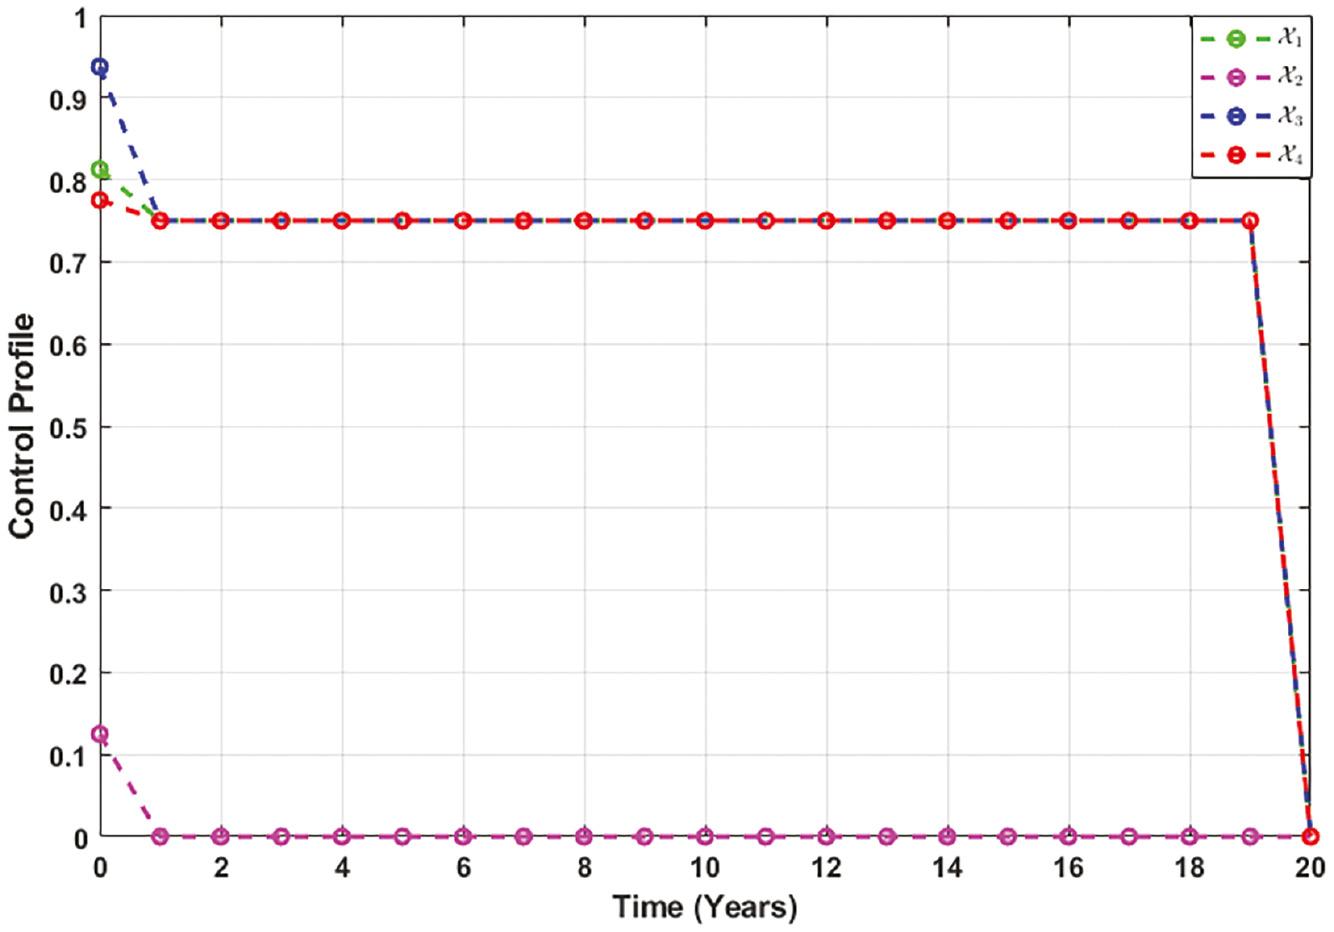
Control 𝒳 1 starts with a 81% efficacy when applied and maintains the level of 75% till the 19th year, indicating stable effectiveness.
Upon implementation, control 𝒳 2 exhibits an initial efficacy of 12%, followed by decreasing behavior.
Control 𝒳 3 begins with an initial efficacy of 94%, which then decreases and stabilizes to 75% till the 19th year.
Control 𝒳 4 initially achieves 78% efficacy, which stabilizes at 75% till the 19th year.
CONCLUSION
This investigation presents an in-depth mathematical examination of the dynamics of malaria and explores the pursuit of optimal strategies for controlling epidemics. The investigation progresses through key stages, commencing with the development and qualitative evaluation of a mathematical model. Subsequently, this model is applied to real-world data concerning the yearly instances of malaria, elucidating the complex dynamics of Plasmodium parasite transmission, and stability is also explored. Furthermore, sensitivity analysis is carried out to pinpoint the key factors that have a significant impact on the spread of the Plasmodium parasite.
This study employs optimal control theory to evaluate and visualize the effect of various strategies for disease control based on estimated parameter values. The graphical findings of this investigation provide practical guidance, enhancing our comprehension of the dynamics of infectious diseases and assisting policymakers and public health authorities in implementing interventions grounded in evidence. Additionally, the investigation explores novel strategies, like incorporating nanotechnology to diagnose and treat malaria and its induced severe brain disabilities, and manage mosquito populations in human habitats.
Looking ahead, future research should focus on improving mathematical models, refining techniques for estimating parameters, validating findings with diverse data sources, evaluating economic consequences, advancing vaccine development, understanding the impact of human behavior, conducting comparative studies, offering evidence-based policy recommendations, and engaging in long-term studies. These efforts will require collaboration and sufficient funding to reduce the global burden of malaria effectively.