
INTRODUCTION
Visceral leishmaniasis (VL), also known as kala-azar, is the most serious disease caused by trypanosomatids—protozoan parasites belonging to the genus Leishmania. This vector-borne disease is transmitted by phlebotomine sandflies and has a complex transmission cycle, in which canines play a major role as hosts [1]. Mammals are possible sources of Leishmania infection, thus resulting in a potentially large number of hosts. People infected with VL typically present with fever, weight loss, anemia, leukopenia, thrombocytopenia, and enlargement of the spleen and liver [2,3], and experience highly incapacitating infection. Patients co-infected with human immunodeficiency virus may display typical clinical symptoms, as first reported in Europe. Although the fatality rate of VL is as high as 75%–90% without effective treatment, its effects on public health have been grossly underestimated [4]. The disease has been classified an epidemic for more than a century worldwide [5]. The first case of VL was reported in Bangladesh in 1820. Since then, large outbreaks of VL have been reported throughout the Indian sub-continent and the Arabian Peninsula [6]. In 1990, VL was responsible for 80.44 disability adjusted life years, ranking second after malaria [7]. Estimates have suggested that 0.5 million new cases and 20,000 to 40,000 deaths due to VL occur globally each year, particularly in South Asia and South America, which account for half of the new cases reported globally [8]. As a neglected tropical disease, VL has been prioritized for control efforts by the World Health Organization in recent years [9].
Global models are essential for public health planning, because they provide information regarding possible ecological variations responsible for regional distribution patterns. Several studies have used ecological niche models to produce regional VL risk maps (generally municipal or provincial). Hay et al. assessed evidence of leishmaniasis and predicted the human population at risk, by using ecological niche models in 2014 [10]. Jiang et al. have used the BRT model to assess VL’s spatio-temporal patterns and risk factors in northwestern and central China [11]. Global climate factors are the main risk factors for VL [12]. Moreover, ecological studies have shown that environmental factors play important roles in VL transmission. The larvae of the Phlebotomus vector require adequate water, whereas the adults require adequate sugar [13]. Changes in landcover and climate influence the habitat of sandflies, and may lead to VL transmission in high-altitude and high-latitude regions. In recent years, Brazil and several European countries have reported an expansion of the disease distribution [14]. In addition, the increasing vulnerability of the population to vector-borne diseases such as dengue fever, Zika, and West Nile fever in the past several decades underscores the urgent need to evaluate the real impact of insect-borne infectious diseases. However, the intensity of VL global outbreaks remains poorly characterized.
This study assessed epidemic research on VL outbreaks and clinical cases by compiling a global database on the disease incidence to reflect its global burden, and mapping the global epidemic situation. An improved evidence base is necessary to identify the most vulnerable population, given that no vaccine is available for VL control. VL risk has sub-national variations, which were modeled with data on symptomatic cases in humans, and various biological, eco-climatic, and environmental covariates. Given the close relationships among the socioeconomic factors influencing VL, we stratified the regions’ development levels according to various socio-demographic indices. In addition, we made global predictions based on previous regional studies, and explored patterns in VL incidence by using various environmental and socioeconomic influencing factors [10].
METHODS
VL cases on a global scale
We assembled a global database of VL incidence and cases from case reports in published articles, unpublished sources, and outbreak data collected on the ground by the authors or their collaborating teams, reporting infrastructures, and national passive surveillance efforts. PubMed and Web of Science were used for document retrieval with the MeSH terms “Leishmaniasis, Visceral,” and additional terms such as “Visceral Leishmaniasis,” “Black Fever,” “Fever, Black,” “Kala-Azar,” and “Kala Azar,” in the titles and abstracts of articles dating from January 1980 to June 2021. All abstracts were added to a bibliographical reference tool, then evaluated to identify information on disease occurrence. Duplicated and irrelevant articles were removed. The Brazilian Ministry of Health has compiled VL infection records at both the municipality and provincial levels by using the reporting network. Similarly, the Chinese Ministry of Health has compiled information at the provincial level.
Modeling of preprocessed data
Individuals with the typical symptoms and signs of VL had the diagnosis confirmed by serology, bone marrow or spleen direct parasitology or culture, or polymerase chain reaction. To understand epidemic trends of VL, we combined the disease outbreak records at the provincial level during the same period. We first discarded unclear and duplicated records, and then obtained information on VL occurrence by using province-level grid data [15]. On the basis of the successful variables used in previous studies at the regional level, we selected global layers of predictors, including eco-climatic, environmental, and socio-economic factors for modeling [16]. The same geographical coordinate system (WGS-84) was used for all data.
Eco-climatic and environmental factors
Eco-climatic data were acquired, including information on 19 bioclimatic variables such as annual average temperature and precipitation. On the basis of the data obtained from Global Climate Data WorldClim 1.4 [17], we extracted 19 grid-level to province-level bioclimatic variables with ArcGIS 10.2 and R 4.2.1 software.
Environmental factors included landcover data and elevation data. Eight landcover types were used to determine the potential response of the pathogen to land utilization. We obtained the landcover dataset with a spatial resolution of 300 × 300 m, spanning from 1992 to 2015, from the European Space Agency Climate Change Initiative. Elevation data were obtained from the Shuttle Radar Topography Mission. All data were converted in the same manner.
Socioeconomic factors
Poverty and neglected tropical diseases are linked, and increase the global burden of disease. VL further aggravates the condition of people living in extreme poverty, particularly those in developing countries and/or countries at war. The socio-demographic index (SDI), proposed by the Institute for Health Metrics and Evaluation, USA, is a comprehensive indicator of the health outcomes of a population or country. The SDI is determined on the basis of the lagging per capita income distribution of a country or region, the total fertility rate of women under 25 years of age, and the average education level of women 15 years or older who have completed schooling [18].
Biological factors
Information on livestock (cattle and sheep) density was obtained from the database on the global livestock distribution in 2010, at a spatial resolution of 10 × 10 km [19]. We estimated the global population with the average human populations of 2005, 2010, and 2015 from the Gridded Population of the World dataset, version 4.0 [20]. Data at the province level were also generated.
Boosted regression tree distribution modeling
We used boosted regression tree (BRT) modeling to determine the environmental factors and socioeconomic status associated with the occurrence of VL worldwide [21]. BRT is a machine learning technique that combines regression trees with gradient boosting. On the basis of how well binary decisions fit into the existing dataset, regression trees were established in accordance with the optimal decision rules, and the boosting technique was used to select the tree minimizing the loss function, which was as follows:


where X = x 1,x 2,…,x n refers to related spatial environmental and socioeconomic correlates; y refers to VL risk; ft (X) represents the mapping function between X and y estimated at the t-th iteration; ϕ is the learning rate; ρt is the weight parameter; and αt defines segment variables. h(X; αt ) links to the expression function of a single tree. ρt and αt were generated with a minimum loss function.
To fit the model, we used the following information components: (i) a complete dataset on the reported locations of VL, (ii) a comprehensive global variate gridded dataset, and (iii) background data to enhance the occurrence data. All three components were used in the model, and the resulting risk and incidence maps were determined.
In the past few years, the BRT model has frequently been used as a predictive approach to model the spread of infectious diseases, including vector-borne diseases such as dengue and onchocerciasis [22,23]. We applied an automated reduction program to filter 19 bioclimatic, 9 environmental, and 3 biological and socioeconomic variables as predictors. All data were run in the “gbm.step” program on several assembly settings to determine the best parameters: the learning rate (0.001, 0.01, 0.03), tree complexity (4, 6, 8), and bag fraction (75%, 80%). Overall, 100 submodels were run. In contrast to internal cross-validation, the presence–absence data were divided, with 80% in a training dataset and 20% in a test dataset in each submodel. The area under the receiver operator curve (AUC) was assessed with the test dataset. Finally, an average model was obtained across the 100 submodels, and the 95% confidence interval (CI) of the predicted probabilities was determined. The population at risk was further estimated on the basis of risk maps. We estimated the vulnerable population by overlapping the population dataset with the areas suitable for VL, wherein the predicted probabilities had thresholds above 0.20, which maximizes the Youden index. The global population at risk was estimated in 2020. All statistical analyses were performed in R 4.2.1 software.
RESULTS
Records of VL cases worldwide
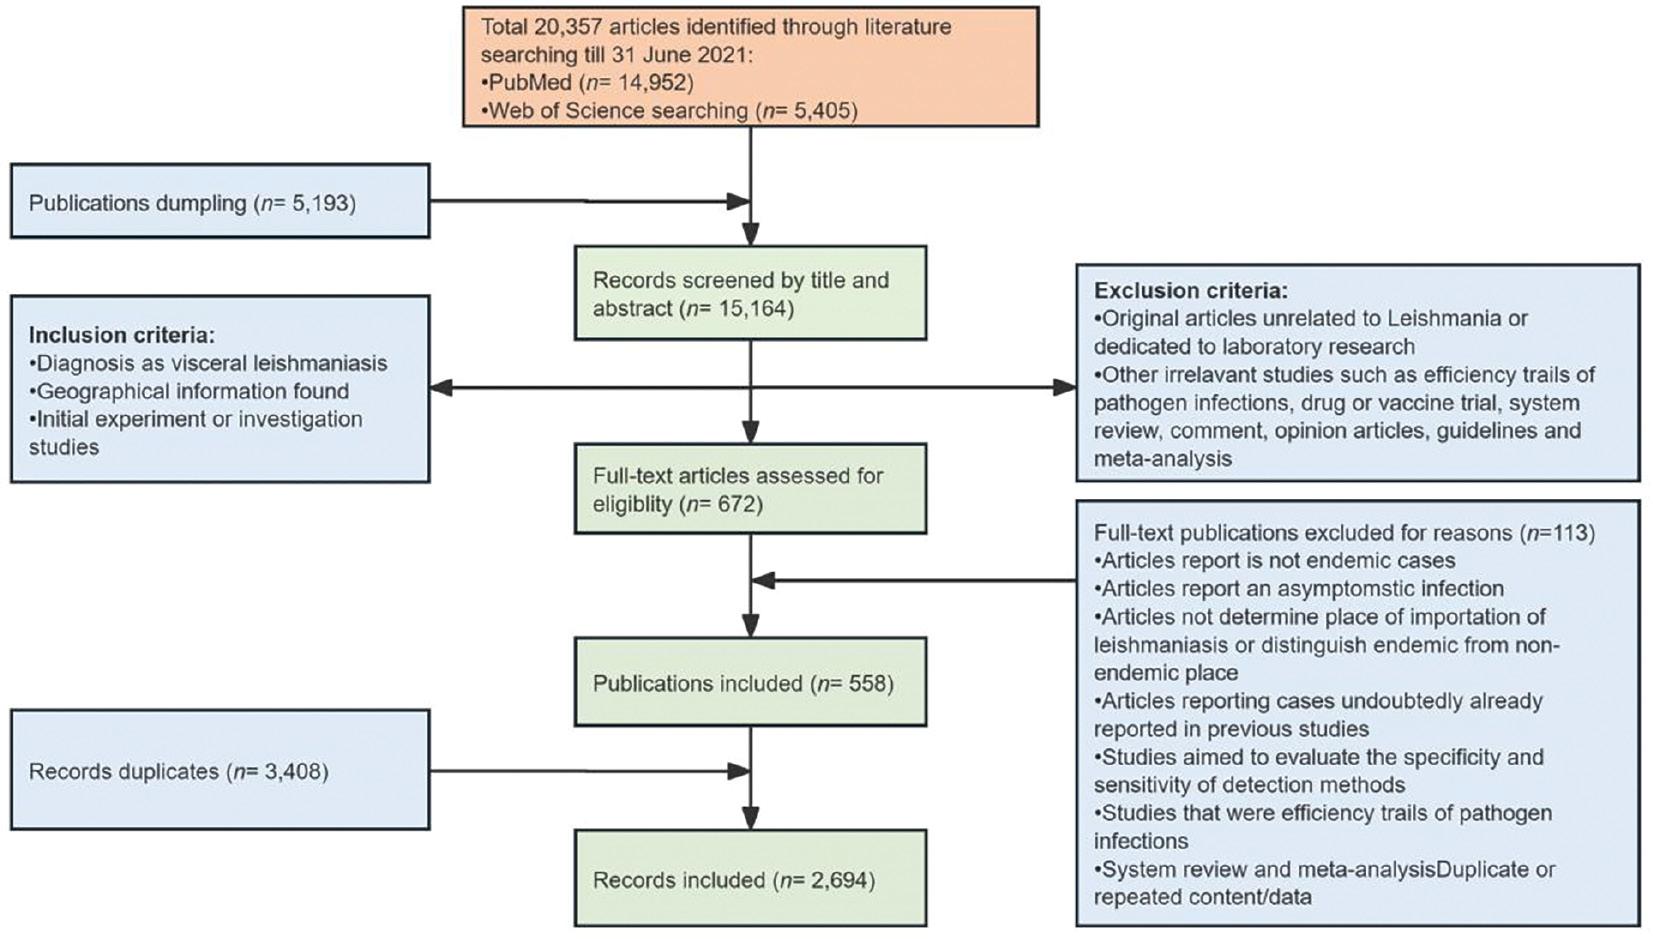
The PubMed and Web of Science databases yielded 20,357 articles until June 31, 2021. PubMed returned 14,952 search results, whereas Web of Science returned 5,405 search results. In total, 5,193 articles with irrelevant diseases, no abstracts, or irrelevant or duplicated content were discarded. A full-text review of all articles was conducted, and 672 (6.03%) articles were retained according to the inclusion and exclusion criteria. The final dataset contained 2,694 records from 310 provinces in 63 countries (Fig 1). We also consolidated the laboratory-confirmed sporadic cases and used epidemic reports to map the global incidence of VL. All records were georeferenced to provinces or states worldwide (classified as Admin 1 by the Food and Agriculture Organization of the United Nations, totaling 3,610 provinces or states).
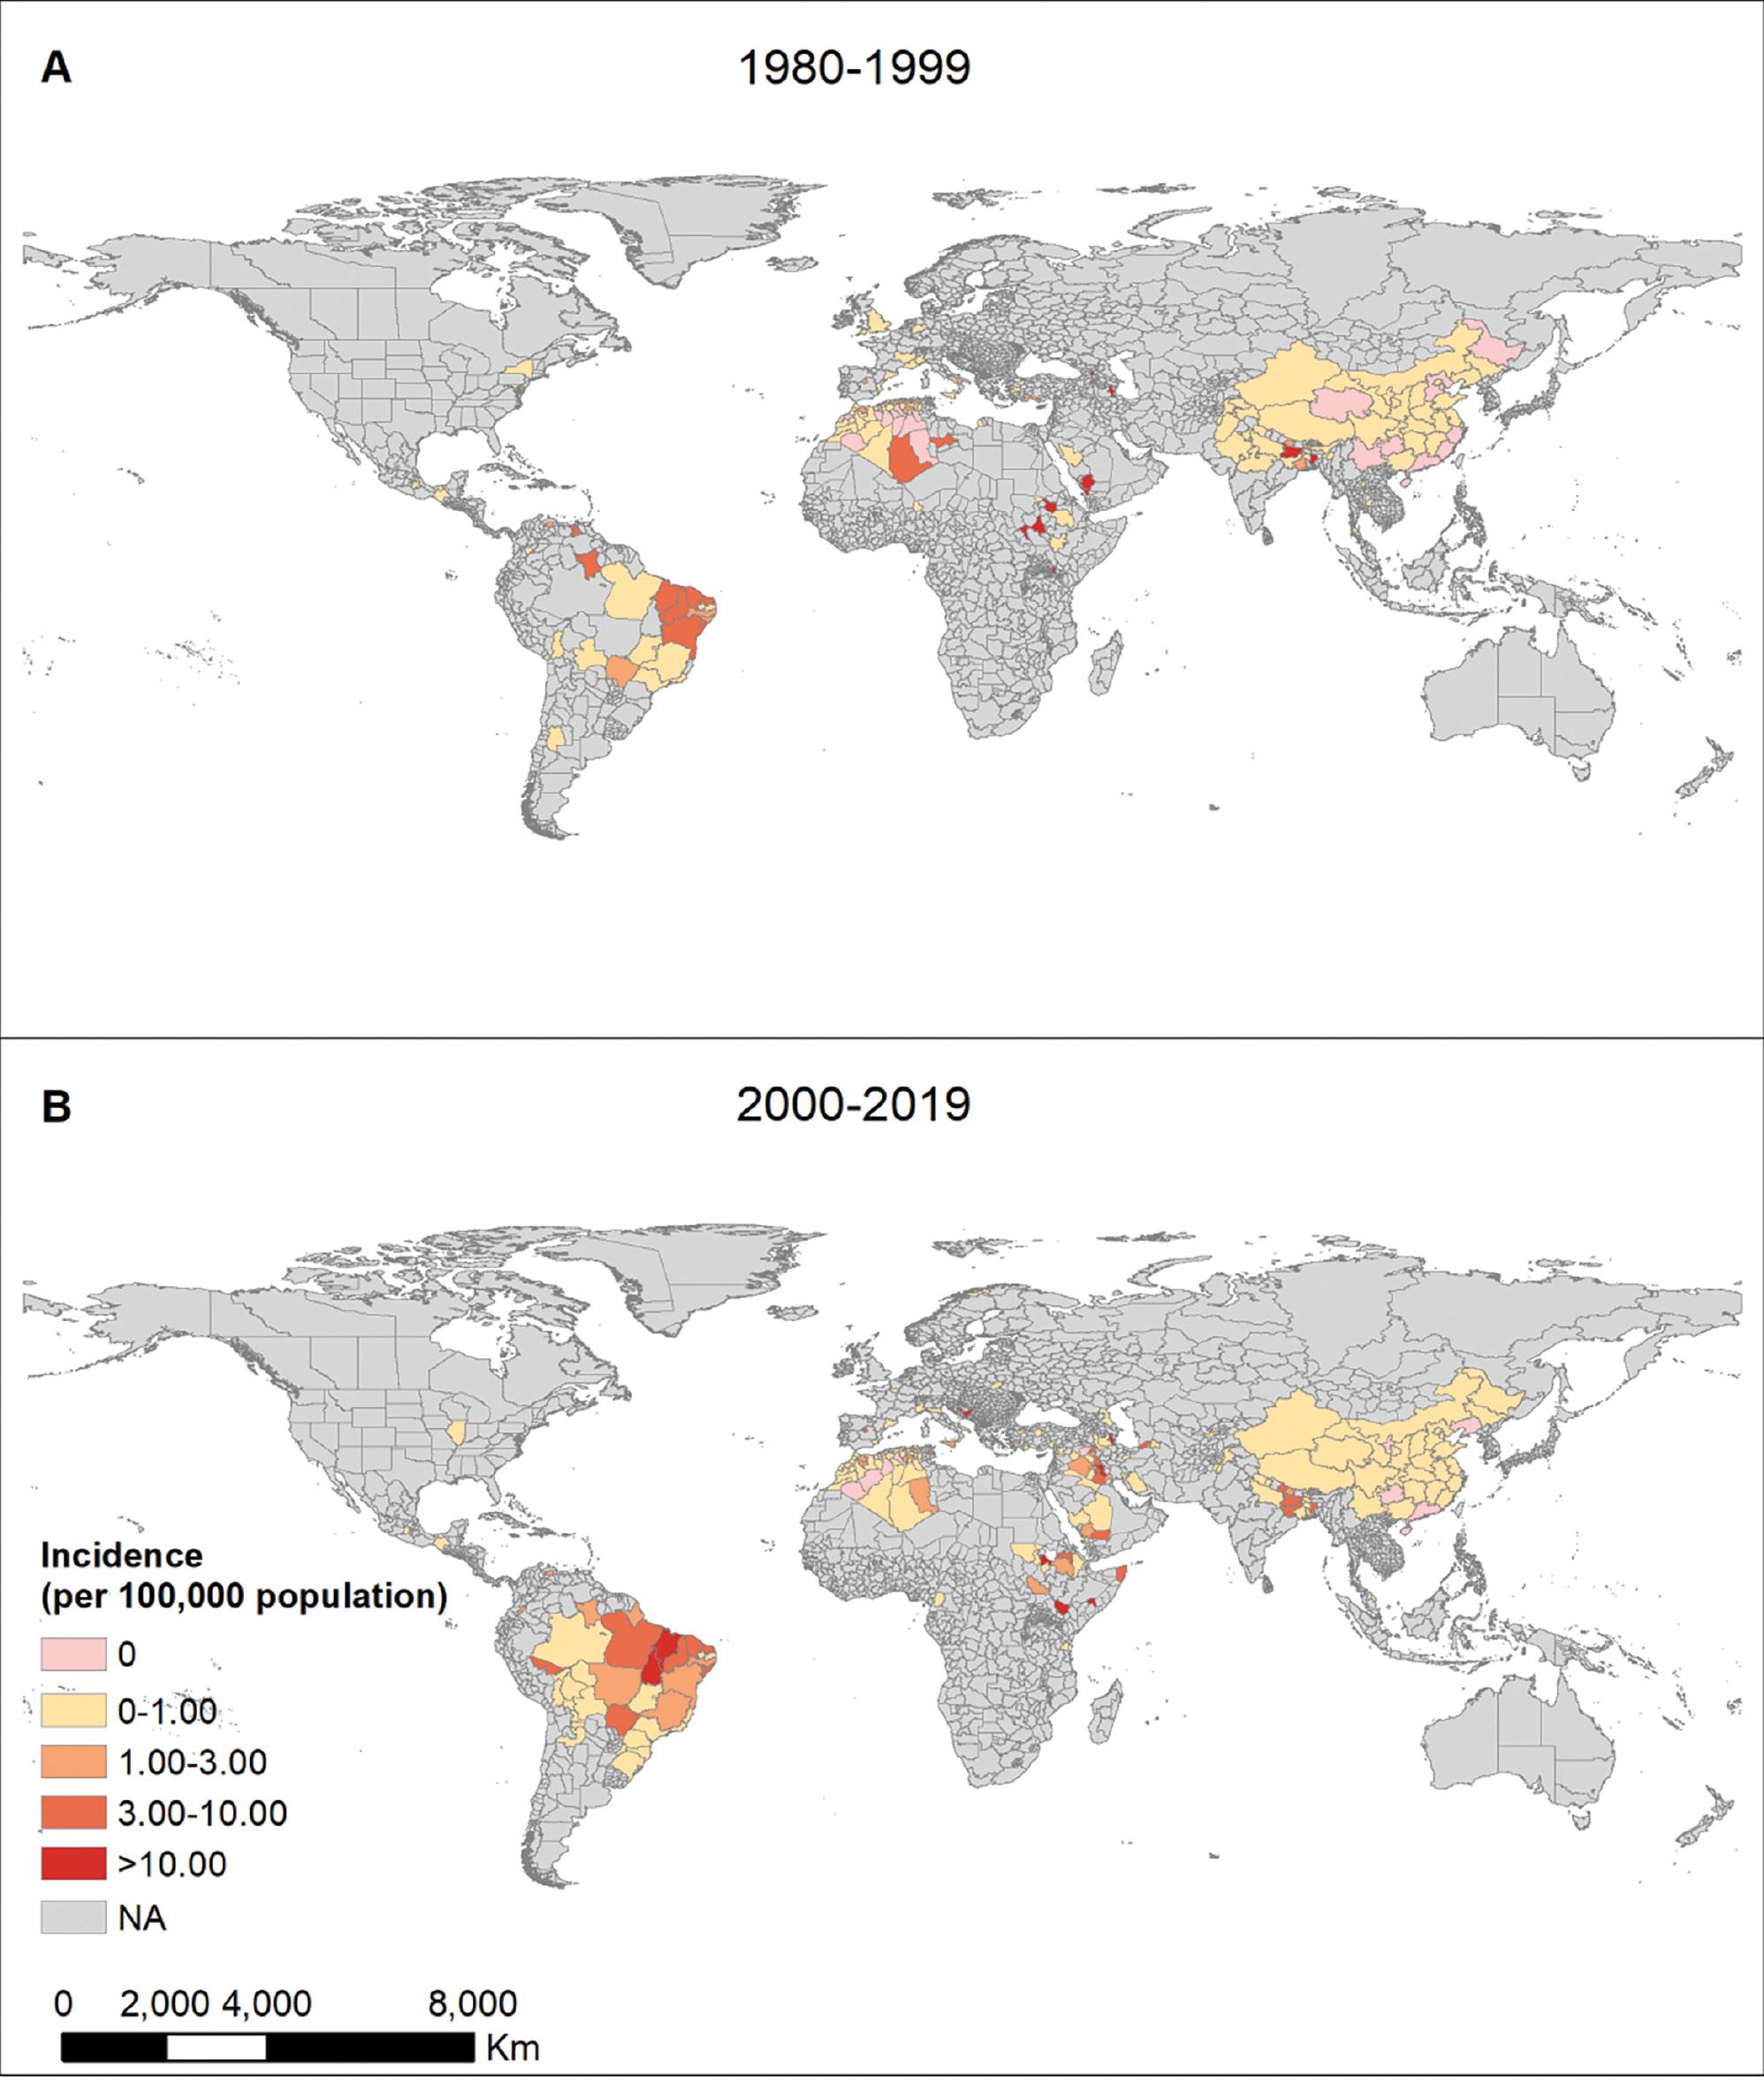
The burden of VL on human lives was not realized until the 1990s, before which the public health impact of the disease was grossly underestimated. We mapped VL incidence at the provincial level spanning four decades, from 1980 to 2000, and from 2000 to 2019, to quantify the global VL burden (Fig 2). Although a fluctuating decreasing trend was observed globally when multiple measures were implemented, major increasing and expanding trends were observed in some countries and territories in recent years. Brazil, Iran, Ethiopia, and India accounted for >90% of VL cases. Brazil and Central European countries demonstrated an expanding VL distribution. The VL epidemic has been reported in 69 countries to date. In addition, 90% of provinces have continually reported VL cases for the past 40 years. Beyond the emergence of new hotspots, previous hotspots continue to report VL outbreaks.
Underlying ecological risk of VL
Twelve major variables with >2% relative contribution (RC) to the occurrence of VL, were identified as important factors with the BRT models (Table 1). One such major contributor was precipitation during the warmest quarter of the year, which had the highest RC, of approximately 28%, and negative effects on VL occurrence. For example, areas with an average precipitation during the warmest quarter below 500 mm were at higher risk of VL (Fig 3). Two temperature-associated factors, mean diurnal temperature and minimum temperature in the coldest month, contributed to the VL risk, with a curvilinear effect. The risk was greater when the mean diurnal temperature range was between 8°C and 17°C, and when the minimum temperature of the coldest month was between −10°C and 10°C. The maximum temperature of the warmest month and the land elevation had positive effects on the spread of VL. For instance, VL risk was higher when the temperature was >20°C, and the elevation was >2200 m. Socioeconomic factors such as the SDI also contributed to VL risk, with quadratic effects. The highest risk was observed when the SDI was between 0.7 and 0.8. A large population of livestock (at least >5,000 animals per square kilometer) was also positively correlated with VL risk. Other environmental factors such as the percentage of cropland and natural vegetation coverage (between 25% and 80%) were associated with high risk of VL.
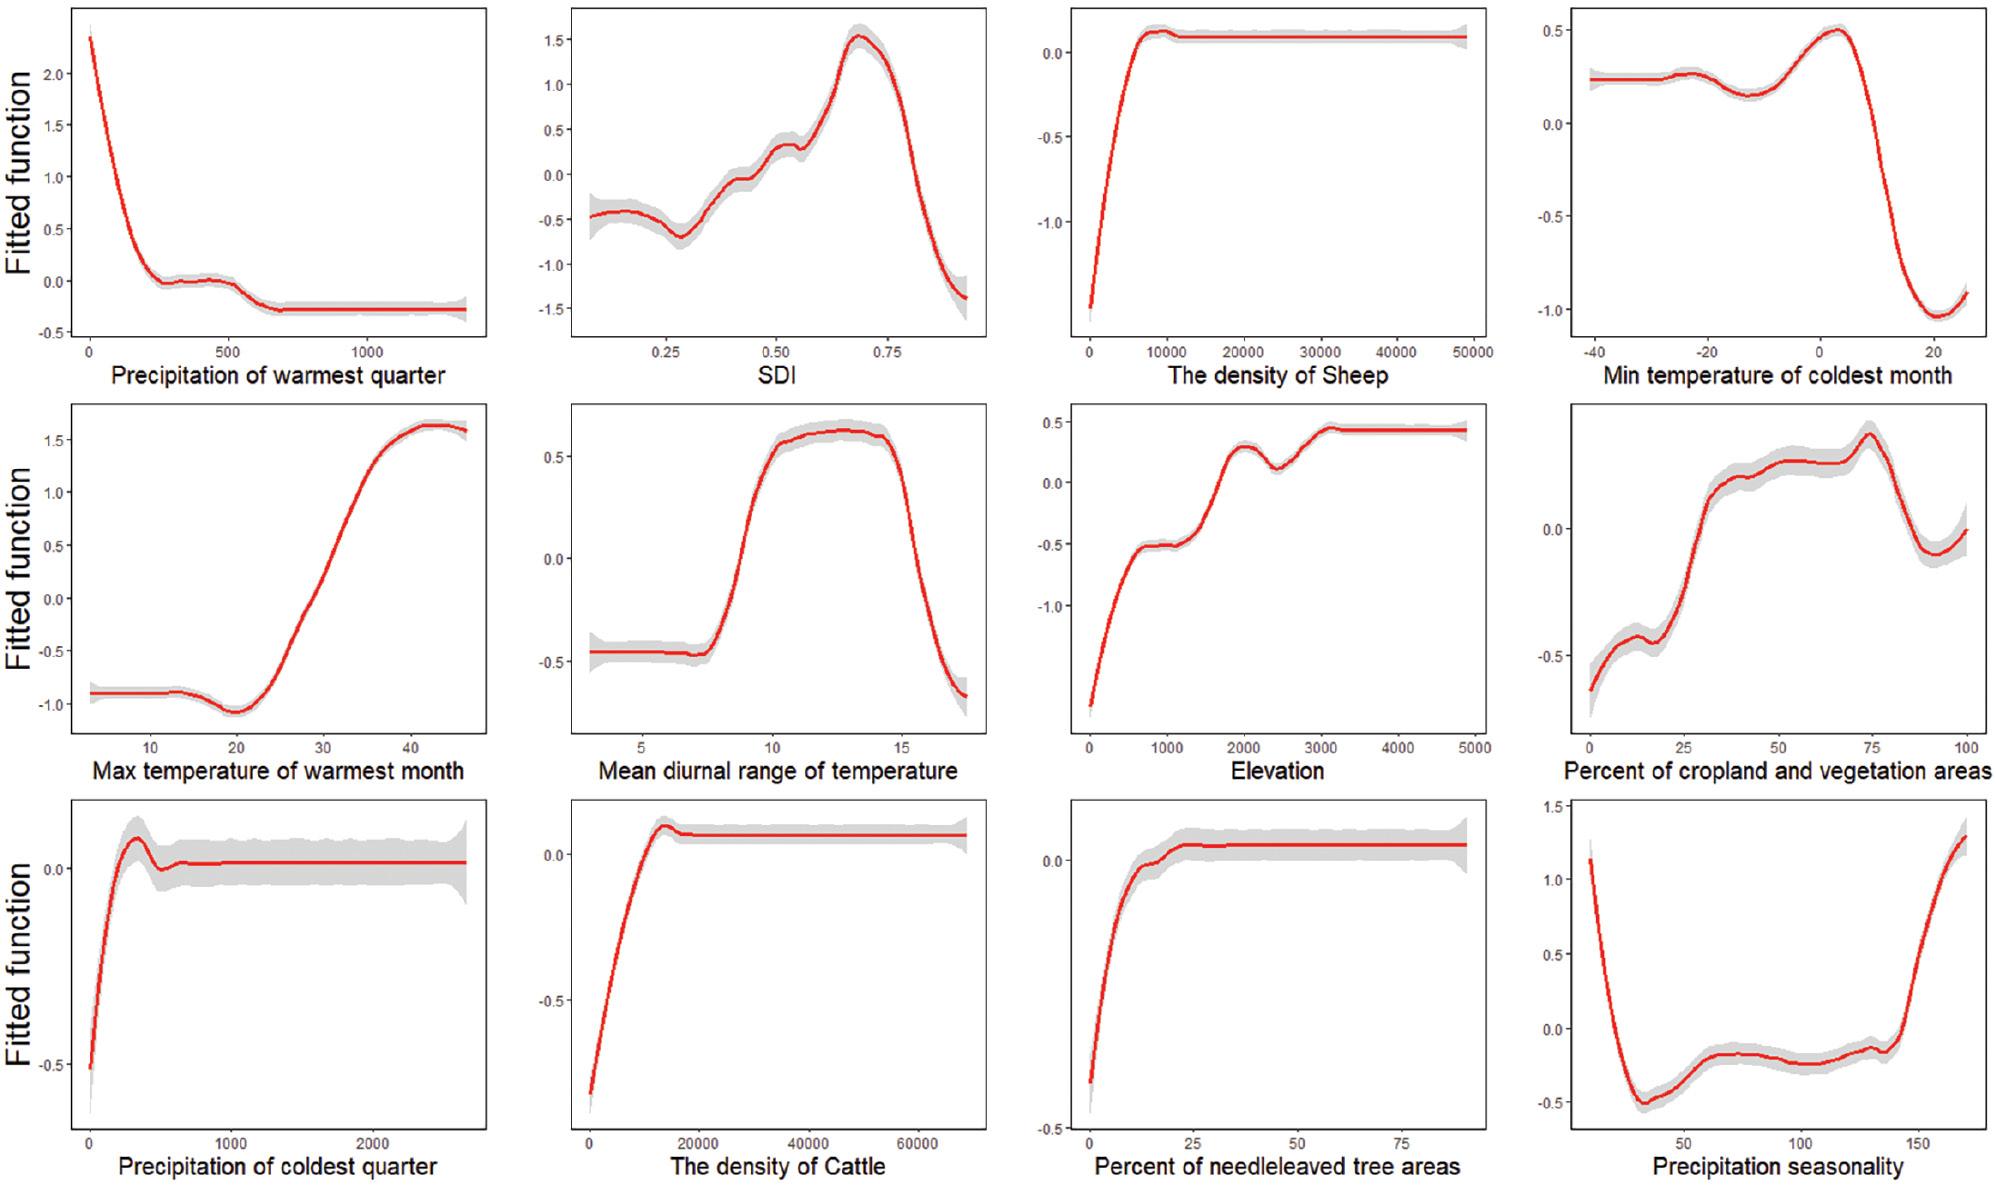
Marginal effect curve lines based on climatic, socioeconomic, and eco-geographical variables with BRT models. The red curves are average predicted lines for risk factors for 100 repeats (gray lines), according to the bootstrapping procedure.
Contributions of environmental variables to predicting the global occurrence of VL* cases, on the basis of the boosted regression trees model.
| Top predictors | Relative contribution | |
|---|---|---|
| Mean | SD* | |
| Ecoclimatic predictors | ||
| Precipitation in warmest quarter (mm) | 28.04 | 2.49 |
| Minimum temperature in coldest month (°C) | 9.15 | 1.52 |
| Maximum temperature in warmest month (°C) | 6.03 | 0.89 |
| Mean diurnal temperature range (°C) | 5.62 | 0.81 |
| Precipitation in coldest quarter (mm) | 3.62 | 0.80 |
| Precipitation seasonality | 2.66 | 0.69 |
| Biological and socioeconomic predictors | ||
| SDI* | 19.77 | 1.76 |
| Density of sheep (1 head/km2) | 9.02 | 1.82 |
| Density of cattle (1 head/km2) | 4.52 | 0.66 |
| Environmental predictors | ||
| Elevation (m) | 4.54 | 0.82 |
| Percentage of cropland and natural vegetation areas (%) | 3.64 | 1.07 |
| Percentage of needle-leaved tree cover areas (%) | 3.35 | 0.65 |
*VL: visceral leishmaniasis; SD: standard deviation; SDI: socio-demographic index.
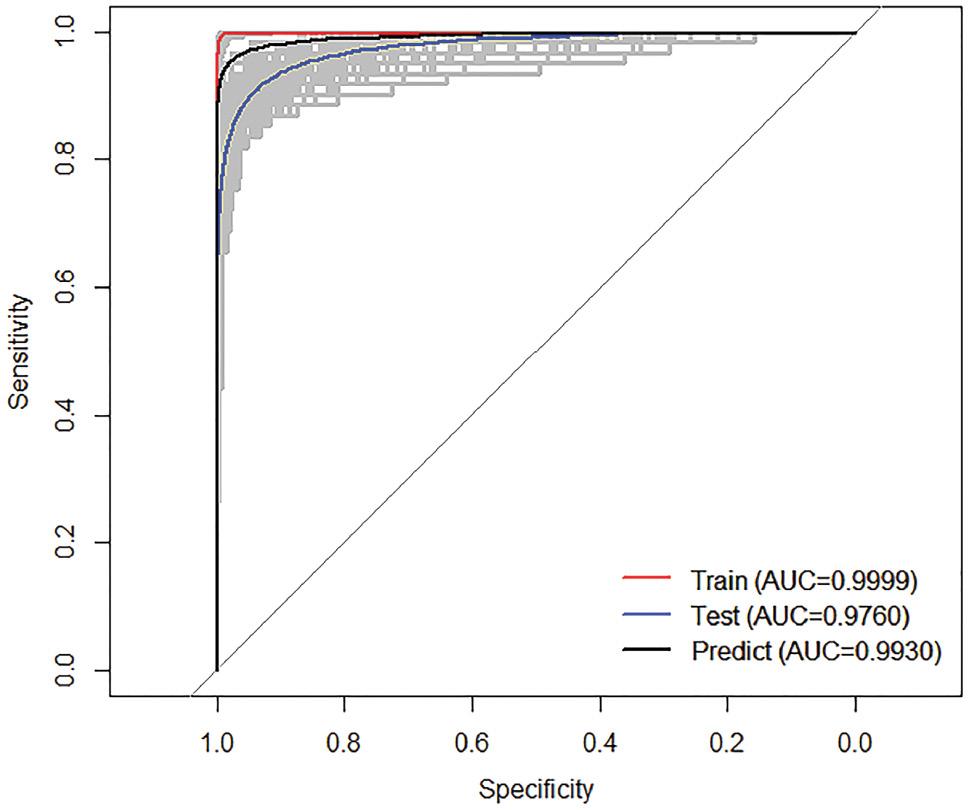
A receiver operating characteristic curve was generated for BRT models (Fig 4). The AUC was calculated to be 0.96 (95% CI: 0.94–0.99). These results suggested that the models can be used to predict the occurrence of VL in humans with high accuracy. The AUC for the training dataset was 0.99 (95% CI: 0.99–0.99), and that for the test dataset was 0.94 (95% CI: 0.92–0.96), thus indicating satisfactory overall predictive performance.
Vulnerable groups and predicted environments
Globally, the risk distribution map for VL revealed the high-risk regions. Most of the at-risk population was found to live in the Mediterranean, Arabian Peninsula, Asia, and South America (Fig 5). Notably, 5.3 billion people (95% CI: 5.0–5.4) were estimated to be at risk of acquiring VL (Table 2). Of these, 3 billion people lived in Asia, primarily in China and India. Africa had approximately 594 million people at risk of affecting VL, most of whom lived in Ethiopia. South America was found to have more than 271 million people living in VL-prone areas, approximately 95% of whom lived in Brazil.
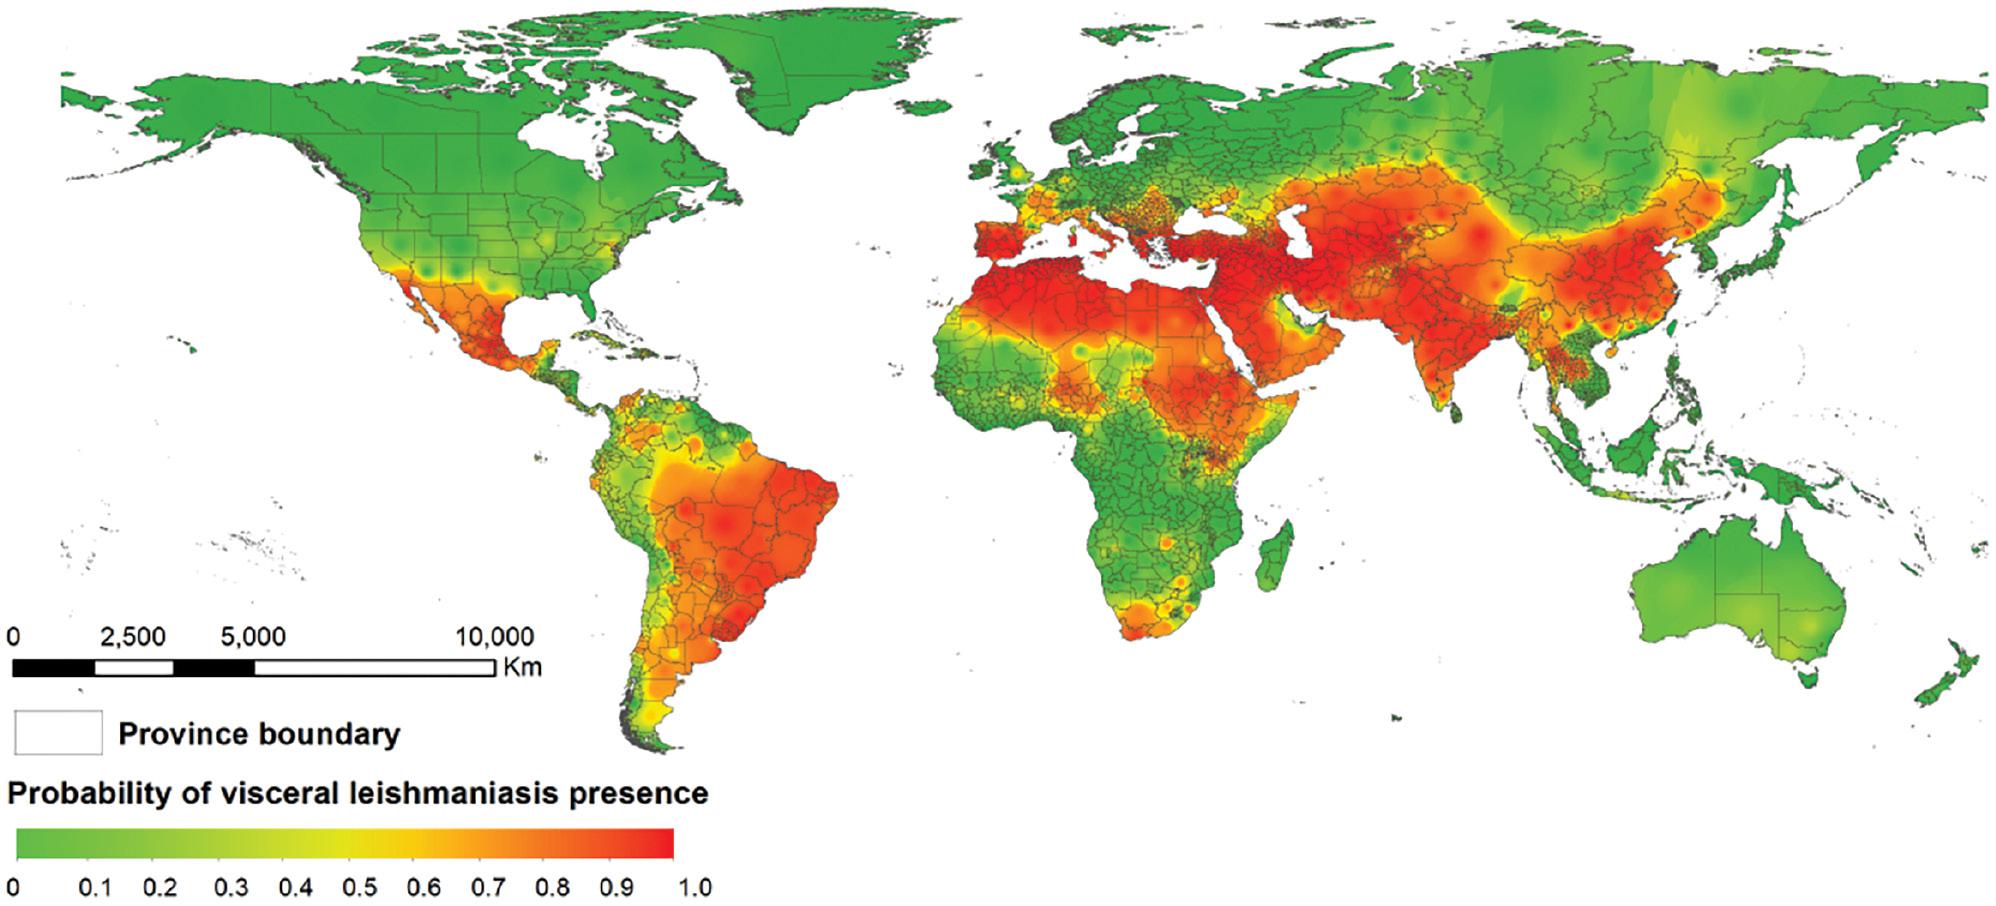
Potential global distribution of human visceral leishmaniasis, according to the BRT model.
Estimated population at risk of VL in 2020, by continent.
| Continent | Millions (95% CI*) |
|---|---|
| Africa | 595 (592–632) |
| North America | 223 (176–229) |
| South America | 347 (325–352) |
| Asia | 3,858 (3,693–3,863) |
| Europe | 277 (264–279) |
| Global | 5,305 (5,050–5,349) |
*CI: confidence interval.
DISCUSSION
This study provides the first comprehensive report on the global incidence of VL at the province/state level, on the basis of a long-term VL dataset. The study demonstrated a westward and centripetal expansion of the disease in Brazil. Similar results have been reported by Guimaraes et al. [24]. In addition, analysis of epidemiological characteristics indicated a resurgence of VL in recent years. Climatic and socioeconomic factors play complex roles in the distribution of VL. Hence, the population vulnerable to this disease must be identified, to ensure that they are provided with effective treatments and suitable vaccines.
Owing to the intricacy and multiplicity of transmission cycles, we used the BRT modeling approach to understand the nonlinear effects of covariance on potential disease outbreaks. Some studies have used case-distribution maps to demonstrate the global burden of diseases, including dengue and yellow fever [25]. This model may also aid in explicitly predicting the dynamics of VL. We constructed high-resolution worldwide risk maps with an established modeling framework combining eco-climatic, environmental, biological, and socioeconomic factors.
Previous studies have demonstrated that VL dynamics are often seasonal, and that low rainfall is a major risk factor associated with the incidence of VL [26]. This mechanism may also explain the correlations among various risk factors for VL. Precipitation affects the disease in various ways, through effects on the wild and domestic animal hosts, and the reproduction cycle of sandflies. Precipitation also increases the risk of infection when people participate in activities outside the home. Suitable precipitation conditions are necessary to provide an organic material supply and maintain favorable animal husbandry conditions. Precipitation is the factor with the greatest influence on the life cycle of sandfly vectors [27]. Notably, high precipitation adversely affects the living conditions of the vector species. The sandfly population peaks in the dry season [13,28]. In our study, precipitation of 20 mm during the warmest quarter of the year increased VL risk. However, when the precipitation was >20 mm, the VL risk decreased. Studies have also illustrated the relationship between hot weather and the dynamics of the sandfly population. Sandfly survival, development, and fecundity are affected by the weather; for example, sandfly metabolism increases with increasing temperature [29]. Sandflies are generally found in temperate regions under rapidly deteriorating environmental conditions, owing to global warming. Global climate change is expected to alter sandfly spatial expansion and to make regions more suitable for sandflies. A northward shift in the population of sandfly vectors has already been documented in Italy.
The SDI has been used to classify the development level of countries to assess the relationships between socioeconomic factors and VL occurrence. Previous studies have shown a positive link between social indicators and the incidence of VL [30]. This risk was shown higher in these countries with the SDI between 0.7 and 0.8, which may account for its more suitable environmental conditions for vector survival, though appropriate surveillance and treatment plan were implemented. However, countries with an SDI of <0.7 are at lower risk of VL, probably because of the absence of disease surveillance and poor diagnosis, owing to low income and inadequate infrastructure.
The existence of diverse ecological niches contributes to the maintenance of the sandfly population. Adequate moisture is necessary for the developmental stages of the vector, whereas sugar resources are essential for adult sandflies. Previous studies have shown overlapping vegetation and VL incidence and vector abundance [31]. A close relationship was found between vegetation coverage intensity and seasonal vector abundance. Land elevation indirectly influences the spread of VL by affecting both the landscape and climate. Some studies have described the influence of elevation on sandfly and mosquito populations [32]. Domestic animals have an adequate supply of blood for maintaining large populations of sandflies. Livestock provides 70% of the blood resources required for supporting sandfly breeding in areas close to human settlement.
Herein, the global risk map for VL revealed high-risk areas in the Mediterranean, Arabian Peninsula, Asia, and South America, and showed consistency with incidence maps. The maps demonstrated potential foci of the disease, and may guide public health interventions, including target areas for monitoring and assessing disease burden. However, several key steps remain necessary for implementing these public health interventions. To develop the most economical strategy to eliminate leishmaniasis by 2030, policymakers should clearly understand the distribution of disease-risk factors. To prevent the spread of leishmaniasis, effective vector-control and preventive measures are needed, such as indoor residual spraying of insecticides, use of insecticide-treated nets, and biochemical treatment of larval habitats. To eliminate VL, the utilization rate of insecticide-treated nets must exceed 96%. In addition, these methods must be used for long time periods to control VL incidence; otherwise, the disease will rapidly recur.
This study has several limitations. First, because of inaccurate data on the reported human cases, particularly the lack of diagnostic methods and public sanitation systems, access to data was lacking, thus hindering the study of leishmaniasis in some low-risk regions. Second, to use the BRT approach, both absence and presence data are required. Provinces without any VL case reports from an established dataset and online reports were considered to be at low risk, and background sampling was used to replace the missing data. Finally, no information was available on the global distribution of various Leishmania species and sandflies, thus potentially leading to overestimation of the population at risk. Part of the vulnerable population might never be exposed to sandflies. In addition, direct exposure to infected blood might also rarely occur.
Despite these limitations, the study findings enabled the construction of a detailed incidence map of VL and support the complex mechanism responsible for the global incidence of this disease. The maps of the population at risk may help identify priority areas for the application of prevention and control measures in efforts to achieve elimination of VL before 2030.