
INTRODUCTION
Emerging infectious diseases (EIDs) are major public health threats that are predicted to increase in response to human activity and global changes [1]. Approximately 30% of all EIDs are vector-borne, including tick-borne diseases (TBDs) [2]. In the US alone, TBDs account for 95% of all vector-borne diseases [3]. Based on current trends, the number of TBD cases has doubled between 2004 and 2016 [4]. As of 2014, 27 distinct TBDs have been discovered in the Western Hemisphere, with more than one-half identified in the last 20 years. While methods of testing are becoming more advanced, there is an undeniable surge in emerging TBDs throughout the Americas. Without immediate and sustained advances in TBD research, this trend is projected to increase [5]. Monitoring tick-borne pathogens and potentially pathogenic microorganisms is essential to mitigating future public health risks.
Lone star virus (LSV) is a newly characterized tick-borne arbovirus in the Bandavirus genus, Phenuiviridae family, and Bunyavirales order. LSV was first isolated from a nymphal lone star tick (Amblyomma Americanum) in 1967 that was collected from a woodchuck (Marmota monax) in Kentucky [6]. Initial research suggested that LSV is a potential pathogen, as indicated by infection and cytopathic effects (CPEs) in various cell lines, and death in experimentally infected mice [6]. LSV was largely left unstudied for >40 years until the genome was sequenced in 2013 following a renewed interest in the potential causative agent of southern tick-associated rash illness (STARI), a disease with an unknown etiologic agent [7]. The connection between LSV and STARI has not been determined; however, it was concluded that LSV infects and induces CPEs in Vero (non-human primate cell line) and Hela cells (human cell line).
Sequencing determined the genomic structure and the putative protein sequences for LSV. Like other bandaviruses, LSV has a tri-segmented single-stranded RNA genome consisting of two segments (large [L] and medium [M]) as a negative sense, while the third segment (small [S]) is an ambisense [7,8]. LSV was initially placed in the Phlebovirus genus based on phylogenetic analysis [7]. However, the most recent (2020) assessment of LSV included a reclassification from the Phlebovirus genus into the newly formed Bandavirus genus, according to the International Committee on Taxonomy of Viruses [ICTV] [9].
The Bandavirus genus is comprised of eight species, including two medically important tick-borne viruses (Dabie bandavirus [DBV] and Heartland bandavirus [HRTV]), which can cause severe and sometimes fatal febrile illnesses known as severe fever with thrombocytopenia syndrome (SFTS) and HRTV disease, respectively. DBV, also known as severe fever with thrombocytopenia syndrome virus (SFTSV), is most often transmitted by Haemaphysalis longicornis and has been reported in several countries, including China, South Korea, Japan, Vietnam, Thailand, and Pakistan [8]. H. longicornis can transmit several viral pathogens, including HRTV, suggesting that H. longicornis may be a capable vector for related viruses [10]. H. longicornis has also been reported in Australia, the Pacific regions, and the US, suggesting the potential for global spread of SFTSV [8]. HRTV is primarily transmitted by A. americanum, suggesting a potential geographic overlap with LSV [11]. Furthermore, the overlap between LSV, SFTSV, and HRTV is a potential threat to public health due to the possibility of reassortment between the segmented genomes of these viruses. The products of reassortment are often deleterious for the virus, but there are rare occasions of successful reassortment, such as occurred with the reassorted Ngari virus within the order Bunyavirales that caused an outbreak of a hemorrhagic fever illness [12]. Due to the potential overlap between LSV, SFTSV, and HRTV, a surveillance study is warranted to monitor LSV in tick vectors and the environment.
Despite the pathogenic potential of LSV, there is a significant lack of information about LSV. However, LSV sequencing has bridged a significant gap in our understanding of LSV and the implications in human or veterinary health. To routinely identify, monitor, and track the geographic range of LSV, a detection and quantification assay is necessary. Molecular detection of viral pathogenic agents is an indispensable tool to monitor and assess potential threats to public health. Currently, the only published detection methods for LSV are through pan-phlebovirus RT-PCR assays; however, these assays cannot discriminate LSV from other viruses [13,14]. To specifically detect LSV, two SYBR green-based RT-qPCR assays detecting the M and S segments of LSV were developed and validated in the current study.
MATERIAL AND METHODS
Cell culture
Vero cells (American Type Culture Collection [ATCC], Manassas, VA, USA) and transfected Vero-Furin cells (BEI) were cultured in Dulbecco’s Modified Eagle Medium (DMEM; Corning, Corning, NY, USA) supplemented with 10% heat-inactivated fetal bovine serum (FBS; Genesee Scientific, San Diego, CA, USA). Transfected Vero-DC-SIGNR cells (a kind gift from Theodore Pierson, NIH/NIAID, Bethesda, MD, USA) were cultured in DMEM supplemented with 5 μg/mL of blasticidin (Thermo Fisher Scientific, Inc., Waltham, MA, USA). HMEC-1 cells (a kind gift from Dr. Rong Fang, UTMB, Galveston, TX, USA) were cultured in MCDB 131 medium (Gibco, Grand Island, New York, USA) supplemented with mouse epidermal growth factor (10 ng/mL; BD Bioscience, San Jose, CA, USA), L-glutamine (10 mmol/L; Gibco), hydrocortisone (1 μg/mL; Sigma-Aldrich, St. Louis, MO, USA), and 10% FBS. Uninfected and infected cells were cultured in separate humidified incubators at 37°C with 5% CO2.
Viruses
Relevant tick-, mosquito-, and sandfly-borne viruses were chosen for specificity testing due to genetic relatedness or geographic overlap. The viruses used in this study were provided by the following institutions: Arboviral Diseases Branch, Division of Vector-Borne Diseases, Centers for Disease Control and Prevention (CDC) Arbovirus Reference Collection (ARC); The World Reference Center for Emerging Viruses and Arboviruses (WRCEVA) at the University of Texas Medical Branch (UTMB); and BEI Resources Repository (NIAID/NIH). Each virus, strain, source material, and resource are listed in Table 1. For viral propagation and quantification, Vero cells were grown to approximately 95% confluence in T75 flasks, then blind-inoculated with 100 μL of virus. Infected Vero cells were incubated as previously described. Flasks were monitored daily for CPEs and cell death. After 50%–75% of the monolayer exhibited CPEs or 10-12 days without evident CPEs, the viruses were harvested from the supernatant and stored at −80°C.
Details of viruses used for assay development.
| Virus | Strain | Source material | Resource |
|---|---|---|---|
| Bourbon virus (BRBV) | Original | RNA | BEI |
| Crimean-Congo Hemorrhagic Fever virus (CCHFV) | IbAr10200 | RNA | BEI |
| Rift Valley Fever virus (RVFV) | ZH501 | RNA | BEI |
| Jamestown Canyon virus (JCV) | 61V-2235 | Active virus | BEI |
| La Crosse virus (LACV) | La Crosse virus | Active virus | BEI |
| Lone Star virus (LSV) | TMA 1381 | Active virus | WRCEVA |
| Massilia virus (MASV) | Prototype | Active virus | BEI |
| Punta Toro virus (PTV) | Balliet | Active virus | BEI |
| Toscana virus (TOSV) | ISS Phl3 | Active virus | BEI |
| Heartland virus (HRTV) | MO4 | Inactivated virus in Qiagen AVL buffer | CDC |
| Uukuniemi virus (UUKV) | S2 | Inactivated virus in Qiagen AVL buffer | CDC |
| Severe fever with thrombocytopenia syndrome virus (SFTSV) | HB29 | Inactivated virus in Whatman FTA card | CDC |
RNA extraction
RNA extraction from Vero cell cultures was performed using an E.Z.N.A. HP Total RNA kit (Omega Bio-Tek, Norcross, GA, USA) according to the manufacturer’s specifications. The concentration and purity of RNA were evaluated using the Nanodrop One Spectrophotometer (Thermo Fisher Scientific, Inc.). RNA was stored at −80°C. Inactivated virus on Whatman FTA card was rehydrated in 100 μL of sterile water 1 h prior to extraction. RNA extracted from either inactivated virus in Qiagen AVL buffer or a rehydrated Whatman FTA card was completed using the QIAamp Viral RNA Minikit (Qiagen, Valencia, CA, USA) according to the manufacturer’s specifications. RNA concentration and purity were assessed as previously described and stored at −80°C.
Primer design
Representative sequences of the M and S segments from the phleboviruses and bandaviruses listed in Table 1 were obtained from the NCBI GenBank database. The sequences were aligned using Geneious Prime software (version 2021.1) utilizing the Clustal W alignment method. Primers were designed using NCBI Primer BLAST software targeting unique regions of the LSV genome compared to related and relevant viruses. One primer set was designed for the M segment (LSV-M; sequence accession: KC589006) and one set for the S segment (LSV-S; sequence accession: KC589007) using the default NCBI Primer BLAST settings. Primers were tested in silico by running a megaBLAST algorithm through NCBI Nucleotide BLAST to determine potential off-target detection in viruses (taxid: 10239), ticks (taxid: 6935), and humans (taxid: 9606). The LSV-M and LSV-S primers were analyzed through the Integrated DNA Technologies (IDT) OligoAnalyzer™ program to determine the possibility of hairpin structures and self-dimer or hetero-dimer formation, with a delta G value cut-ff weaker than −9.0 kcal/mol. Primers for the LSV assay were synthesized by IDT (Table 2). RNA from LSV-infected Vero cells was reverse-transcribed using LunaScript RT Supermix (New England Biolabs [NEB], Ipswich, MA, USA) to obtain 1 μg/μL of cDNA according to the manufacturer’s specifications. The resulting cDNA was either stored at −20°C or used immediately. Plasmid primers were designed by NCBI Primer BLAST and synthesized by IDT to express the entire desired amplicon to ensure the target sequence was not obstructed during cloning. Plasmid primers were designated as LSV-M’ and LSV-S’ for the M and S segments, respectively, and are listed in Table 2.
Details of primers designed for LSV detection and plasmid insertion.
| Gene segment | Primer set | Sequence (5’-3’) | Position | Amplicon size (bp) |
|---|---|---|---|---|
| Segment M | LSV-M | F: TCCTTCTAGCAGTTGGCAGC | 2630–2649 | 152 |
| R: AGTAGCCCCATGTGAACAGC | 2762–2781 | |||
| LSV-M’ | F: ATTTGCAGGTCTCTCGCTCC | 2337–2356 | 502 | |
| R: GCTTGGGCATTCTAGGGAGG | 2819–2838 | |||
| Segment S | LSV-S | F: GAAGCTTGCCCCTGATGACT | 166–185 | 263 |
| R: CTGGACCCATAGGGAGGGAA | 409–428 | |||
| LSV-S’ | F: GACCCTGTCAAAATGCTGGC | 137–156 | 826 | |
| R: TTACTTCAGCACCTCCTTCGG | 942–962 |
F, forward primer; R, reverse primer; bp, base pair.
Molecular cloning
LSV RNA was reverse-transcribed and amplified individually with plasmid primers (LSV-M’ and LSV-S’), as previously described. Amplicons were analyzed for appropriate size on 1% agarose gel electrophoresis. Fragments were inserted into the pMiniT 2.0 vector and transformed into competent E. coli with the NEB PCR Cloning Kit according to the manufacturer’s specifications. Plasmid DNA was extracted with the E.Z.N.A. Plasmid DNA Mini-kit I (Omega Bio-Tek) according to the manufacturer’s specifications. DNA purity and concentration were assessed with the Nanodrop One Spectrophotometer. Plasmid DNA was sequenced by Eurofins Genomics (Louisville, KY, USA) utilizing Sanger sequencing. Resulting sequences were compared against the NCBI Nucleotide BLAST database to determine similarity percentage to the published sequence of LSV. After confirmation through sequencing, the ZymoPure II Maxiprep kit (Zymo Research, Irvine, CA, USA) was used to extract DNA plasmid according to the manufacturer’s specifications. DNA concentration and purity were assessed as previously described.
Standard curve development
The plasmid was linearized using the MssI (PmeI) restriction endonuclease (Thermo Fisher Scientific, Inc.) according to the manufacturer’s specifications. The linearized plasmid was subjected to in vitro transcription using the MEGAscript T7 Transcription kit (Thermo Fisher Scientific, Inc.), followed by the MEGAclear Transcription Clean-Up Kit (Thermo Fisher Scientific, Inc.) according to the manufacturer’s specifications. A second RNA clean-up was performed using the Monarch RNA Clean-Up Kit (NEB) according to the manufacturer’s specifications. The RNA transcript concentration and purity were assessed as previously described. The ssRNA copy number was determined from the RNA concentration using the formula stated in the Qiagen QuantiFast® SYBR® Green PCR Handbook [15]. The cRNA was serially diluted 10-fold with RNase-free water. The serial dilutions were reverse-transcribed using the Protoscript First Strand cDNA Synthesis Kit (NEB) according to the manufacturer’s specifications. The resulting DNA was subjected to qPCR using PowerTrack SYBR Green qPCR Mix (Thermo Fisher Scientific, Inc.) according to the manufacturer’s specifications, with the exception of a final primer concentration of 500 nM. Standard cycling was performed with 1 cycle at 95°C for 2 min, then 40 cycles at 95°C for 15 s and 60°C for 60 s. Amplification was followed with a dissociation curve from 60°C to 95°C with a 0.5°C increase every 5 seconds. No-template controls (NTCs) were used for each qPCR run to ensure that no contamination or non-specific binding occurred. Standards were performed in triplicate three independent times.
Limit of detection
To determine the limit of detection (LOD), in vitro-transcribed RNA ranging from 1.7 × 10²–1.7 × 10⁻² copies/μL for the LSV-M assay and 1.8 × 10²–1.8 × 10⁻² copies/μL for the LSV-S assay were tested in 4 independent assays with 10 replicates each. The in vitro-transcribed RNA was reverse-transcribed using the Protoscript First Strand cDNA Synthesis Kit (NEB) according to the manufacturer’s specifications. The resulting cDNA was subjected to qPCR as previously described. The percent positive (detected) wells were analyzed by non-linear regression using a Sigmoidal, 4-parameter curve on GraphPad Prism 2022.1.1. The top and bottom constraint types were set to 100 and 0%, respectively, under the constrain tab to reflect the boundaries of the data. The 95% and 50% LODs were interpolated from the LOD non-linear regression curve. The 50% LOD was used to determine the cut-off (Co) cycle for both assays.
Specificity
Related and relevant viruses listed in Table 1 were tested against each developed primer pair to determine off-target recognition. Initially, in silico specificity was performed as described in primer design and using Geneious Prime 2022.1.1. software to determine if the developed primers recognized representative sequences of the related viruses used in this study (Table 3). RNA from each related virus was reverse-transcribed using LunaScript RT Supermix (NEB) according to the manufacturer’s specifications. Depending on the concentration of source material, RNA input for cDNA synthesis ranged from 11.2 ng–1 μg of RNA. The cDNA was tested through qPCR analysis in duplicate two independent times against the developed primer pairs as previously described. Positive controls were included using primers for each related virus to confirm the presence of the related virus. Primers for each virus were obtained either from previous publications or in-house designed and are shown in Table 3.
Details of primers used for detection of related and relevant viruses.
| Virus | Sequence (5’-3’) | Source |
|---|---|---|
| Heartland virus (HRTV) | F: TGCAGGCTGCTCATTTATTC | [16] |
| R: CCTGTGGAAGAAACCTCTCC | ||
| P: FAM-CCTGACCTGTCTCGACTGCCCA | ||
| Bourbon virus (BRBV) | F: GCAAGAAGAGGCCAGATTTC | [17] |
| R: TCGAATTCAGCATTCAGAGC | ||
| P: FAM-CCTCACACCACGGAAGCTGGG | ||
| Severe fever with thrombocytopenia syndrome virus (SFTSV) | F: CATCATTGTCTTTGCCCTGA | [18] |
| R: AGAAGACAGAGTTCACAGCA | ||
| Uukuniemi virus (UUKV) | F: GATGCCAATGACTCTGCCCT | This study |
| R: TGGACGGCTTTGTTCACCTT | ||
| Punta Toro virus (PTV) | F: ACACAAAGACCGGCACATCTCAC | [19] |
| R: GTGCATATGAAGACCATCCAATCC | ||
| Massilia virus (MASV) | F: GCCTACAGGACTTGCTTCGT | This study |
| R: CAGTGTCAGCACTTGGTTGC | ||
| La Crosse virus (LACV) | F: ATTTGGAGAGTGGCAGGTGG | This study |
| R: AATTCCAATGGTCAGCGGGT | ||
| Toscana virus (TOSV) | F: GAGTTTGCTTACCAAGGGTTTG | [20] |
| R: AATCCTAATTCCCCTAACCCCC | ||
| Jamestown Canyon virus (JCV) | F: GCAGGGTTTGTGGCATTTATGG | [21] |
| R: TTTCCGCTCCGGTTTACGAG | ||
| Rift Valley Fever virus (RVFV) | F: AAGGCAAAGCAACTGTGGAG | [22] |
| R: CAGTGACAGGAAGCCACTCA | ||
| Crimean-Congo Hemorrhagic Fever virus (CCHFV) | F: AACAGCCCTAGCACACCATC | This study |
| R: GTGTTCAGTGGCGTTGTGAC |
F, forward primer; R, reverse primer; P, probe.
Plaque assay
Vero cells were seeded at a density of 1.2 × 10⁶ cells/well in 6-well plates with 2 mL of DMEM and incubated overnight. LSV viral stocks were thawed and serially diluted 10-fold 5 times in DMEM. Media was removed from the 6-well plates, washed with phosphate-buffered saline (PBS; Corning), and 300 μL of the diluted virus was added to each well in duplicate. Negative controls were included to ensure no viral contamination was present and to account for any issues with plate coating. The plates were incubated for 1 h at room temperature (RT; approximately 25°C) with constant rocking for viral absorption. The virus was removed from each well and washed with 1 mL of PBS. A semi-solid overlay containing an 11% mixture of 4% SeaPlaque (Lonza, city, state, country) in DMEM was added to each well and allowed to solidify at RT for 15 min. Plates were incubated as previously described and checked daily for CPEs with a light microscope. After 4 days cells were fixed with 37% formalin for at least 1 h and stained with crystal violet for plaque visualization and quantification. This experiment was repeated with modifications, as follows: for an 11-day incubation; for an absorption temperature of 37°C for 6- and 11-day incubations; with transfected cell lines (Vero-DC-SIGNR and Vero-Furin) with RT absorption and a 6-day incubation, and HMEC-1 cells with RT absorption for a 4-day incubation.
Quantification of in vitro infected samples
Vero cells were seeded in 6-well plates as previously described. Media was removed from each well and washed once with 1 mL of PBS. The cells were inoculated with 100 μL of the viral sample and incubated for 1 h at RT with constant rocking. The virus was removed and wells were washed with 1 mL of PBS. Two milliliters of DMEM were added to each well and plates were incubated as previously described. RNA was extracted with the E.Z.N.A. HP Total RNA Kit according to the manufacturer’s specifications 4, 12, 24, 48, 72, and 96 h post-infection (hpi). The RNA concentration and purity were assessed as previously described. RNA was reverse-transcribed using the LunaScript RT Supermix for a total amount of 1 ug of RNA according to the manufacturer’s specifications. qPCR was performed using PowerTrack SYBR Green Mastermix (Thermo Fisher Scientific, Inc.) with each developed LSV primer according to the manufacturer’s specifications except a final primer concentration of 500 nM. The viral load of unknown samples was determined by modifying the linear regression equation from the standard curve, as stated in the BioRad Real-time PCR Applications Guide for the determination of an unknown sample for absolute quantification [23].
Tick collection, processing, and testing
Ticks were collected from 2019–2022 and 143 ticks were used for this study. Collection areas were centered in southeast Texas from the following counties: Liberty; Montgomery; Polk; San Jacinto; and Walker. Tick samples were obtained from field collection, veterinary clinics, and taxidermy shops. Field collection utilized dragging with a light-colored cloth and CO2 traps. The collected ticks were either preserved in 70% ethanol, 95% ethanol, or at −80°C. Tick identification was based on morphologic characteristics through published taxonomic keys [24–28]. RNA was extracted from the ticks using the E.Z.N.A. Viral RNA Kit (Omega Bio-Tek) according to the manufacturer’s specifications. RNA concentration and purity were assessed as previously described. The tick RNA was reverse-transcribed with the Protoscript First Stand Synthesis Kit (NEB) according to manufacturer’s specifications. Tick cDNA was tested in duplicate with the developed assays with PowerTrack SYBR Green Mastermix according to the manufacturer’s specifications, and data were assessed for amplification and the melting temperature™.
Statistical analysis
All statistical analyses were performed using GraphPad Prism (version 9.4.1; GraphPad Software). Simple linear regression was performed to determine the slope, y-intercept, standard error, and goodness of fit. Descriptive statistics were used to determine the coefficient of variation (CV) for intra- and inter-assay variation.
RESULTS
Sequencing of LSV segments M and S inserts in plasmid vector
Portions of the M and S genetic segments were individually cloned to provide a template for the development of the standard curve. The insert was sequenced to ensure no significant changes were made in the primer binding sites and desired template. The M segment cloned by the LSM-M’ primers was 99.6% similar to the published M segment sequence of LSV, with only 2 base pair changes occurring in the sequence. Neither alteration to the sequence was in the primer binding sites and only one base pair change was made in the desired template area between the primer binding sites. The S segment cloned by the LSV-S’ primers was 100% identical to the published S segment sequence of LSV.
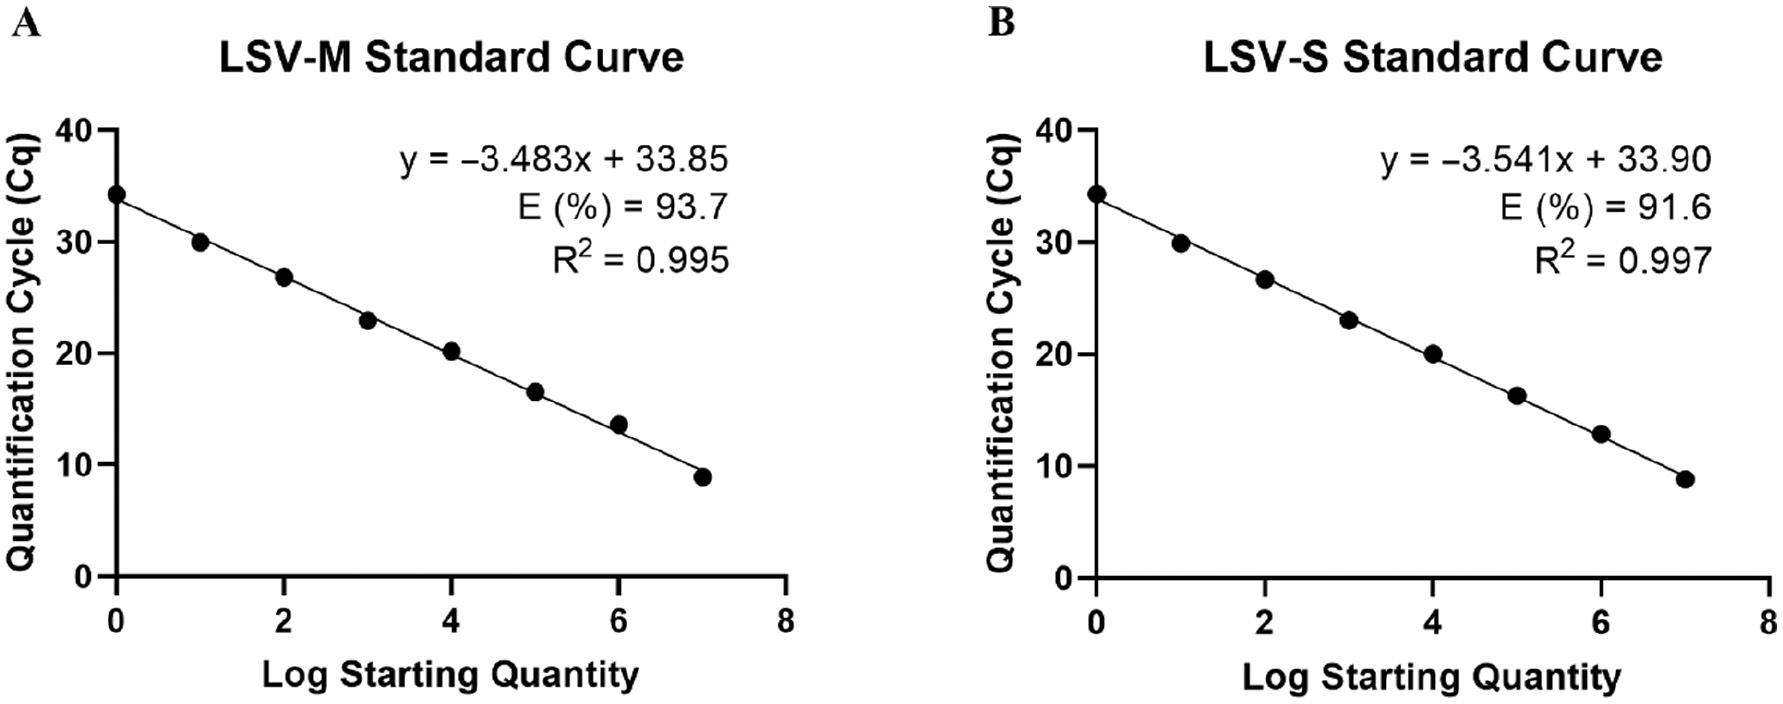
Standard curve of LSV-M and LSV-S assays
The plasmid inserts of LSV-M’ and LSV-S’ were digested with a restriction endonuclease and transcribed with a T7 RNA polymerase in vitro to form an RNA template for an absolute quantification standard curve. The in vitro transcribed RNA was serially diluted from 1.7 × 10⁷–1.7 × 100 copies/μL for the LSV-M assay and 1.8 × 10⁷–1.8 × 100 copies/μL for the LSV-S assay. The RNA was reverse-transcribed, then tested with qPCR in triplicate three independent times.
Each replicate of the serial dilution series for the LSV-M and LSV-S assays exhibited a square of the Pearson coefficient (R2) >0.99 and efficiency (E) >90% (Fig 1; S1 Table). Each replicate was assessed for intra- and inter-assay variation described as the CV. LSV-M exhibited intra-assay CVs ranging from 0.185%–4.67% and inter-assay CVs ranging from 0.759%–4.65% (S2 Table). Overall, the LSV-M assay had an average intra-assay CV of 1.80% and inter-assay CV of 2.64%. LSV-S had intra-assay CVs ranging from 0.377%–5.64% and inter-assay CVs ranging from 0.435%–6.21% (S2 Table). Overall, the LSV-S assay had an average intra-assay CV of 2.00% and an inter-assay CV of 1.99%. The overall intra- and inter-assay CVs for the LSV-M and LSV-S assays suggested a high reproducibility of the presented assays.
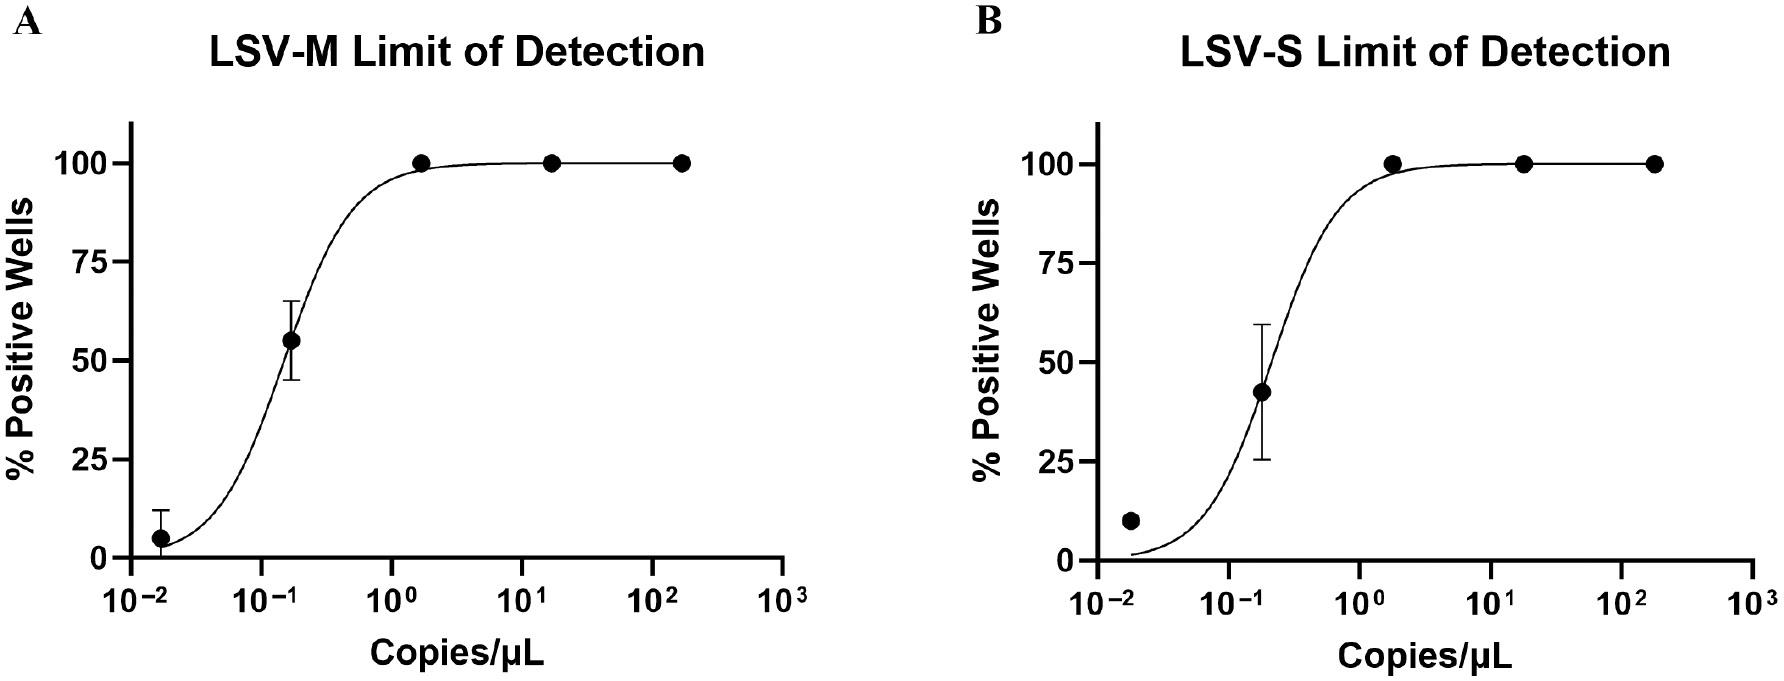
Limit of detection for LSV-M and LSV-S assays
The LOD for the LSV-M and LSV-S assays were determined by 10 replicates of serially diluted in vitro transcribed RNA in four independent assays. The 50% and 95% LODs were interpolated from the non-linear regression curve formed by the LOD experiment shown in Fig 2. The LSV-M assay had a 50% LOD of 0.15 copies/μL (95% CI, 0.11–0.17) and 95% LOD of 0.89 copies/μL (95% CI, 0.40–1.85; S3 Table). The LSV-S assay had a 50% LOD of 0.21 copies/μL (95% CI, 0.17–0.38) and 95% LOD of 1.18 copies/μL (95% CI, 0.37–3.23; S3 Table). Both assays could detect <2 copies/μL of viral genome 95% of the time and <1 copies/μL 50% of the time, suggesting that both assays were highly sensitive for low concentrations of LSV genomic M and S segments in a sample. The Co was 36.82 cycles (95% CI, 36.62–37.20) and 36.29 cycles (95% CI, 35.38–36.63) for the LSV-M and LSV-S assays, respectively, as determined by the 50% LOD. Additionally, the 95% LOD corresponded to 34.08 cycles (95% CI, 32.96–35.32) and 33.65 cycles (95% CI, 32.10–35.43) for the LSV-M and LSV-S assays, respectively.
Specificity of LSV-M and LSV-S assays
The LSV-M and LSV-S assays were tested for specificity against 11 tick-, mosquito-, and sandfly-borne viruses for cross-reactivity in duplicate in two independent assays. Table 4 displays the results for specific detection of LSV against 11 related and relevant viruses for the LSV-M and LSV-S assays. The LSV-M assay detected 8 of the 11 tested viruses. HRTV, MASV, LACV, and JCV were all detected prior to the determined Co. The detection of HRTV, PTV, MASV, LACV, TOSV, JCV, and CCHFV with the LSV-M primers were all distinguishable from LSV through the dissociation curve with a dissimilar Tm from LSV or the absence of a clean peak above the threshold. The detection of UUKV with the LSV-M primers had a similar Tm to LSV (82°C); however, the melting peak of UUKV was distinguishable from LSV due to the presence of multiple peaks in the dissociation curve (Fig 3). The LSV-S assay detected 6 of the 11 tested viruses; however, off-target detection surpassed the Co. The detection of UUKV, PTV, MASV, LACV, TOSV, and JCV were all distinguishable from LSV through the lack of a Tm above threshold or a dissimilar Tm from LSV. The data suggested that the LSV-S assay was highly specific for the detection of LSV; however, the LSV-M assay displayed less specificity due to the amplification of related viruses and potential for a similar Tm.
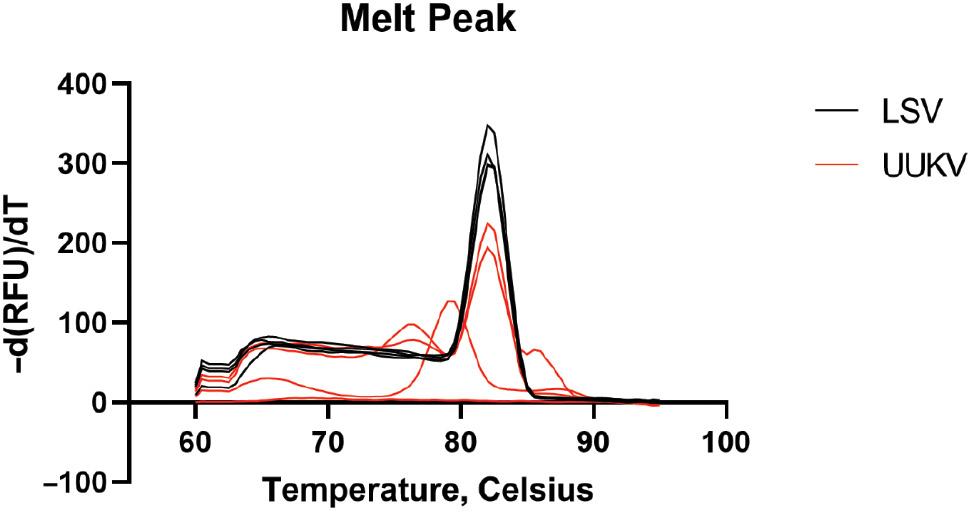
Comparison of melt peaks for LSV and UUKV following the LSV-M assay. The melting peaks for LSV (shown in black) and UUKV (shown in red) show single, consistent peaks for LSV and multiple, inconsistent peaks for UUKV, despite an average of 82°C for both melt peaks.
Specificity of LSV-M and LSV-S primers against 11 related and relevant viruses.
| Virus | LSV-M | LSV-S | ||
|---|---|---|---|---|
| Ave. Cq value | Tm °C | Ave. Cq value | Tm °C | |
| Lone Star virus (LSV) | 8.514 | 82 | 13.524 | 85.5 |
| Heartland virus (HRTV) | 34.571 | 76.5 | NEGATIVE | NEGATIVE |
| Bourbon virus (BRBV) | NEGATIVE | NEGATIVE | NEGATIVE | NEGATIVE |
| Severe fever with thrombocytopenia virus (SFTSV) | NEGATIVE | NEGATIVE | NEGATIVE | NEGATIVE |
| Uukuniemi virus (UUKV) | 37.633 | 82 | 39.034 | 78.5-79 |
| Punta Toro virus (PTV) | 37.262 | NEGATIVE | 39.412 | NEGATIVE |
| Massilia virus (MASV) | 35.804 | NEGATIVE | 37.754 | NEGATIVE |
| La Crosse virus (LACV) | 34.044 | 75.5 | 39.274 | NEGATIVE |
| Toscana virus (TOSV) | 37.484 | NEGATIVE | 38.963 | NEGATIVE |
| Jamestown Canyon virus (JCV) | 33.544 | 75.5 | 37.344 | NEGATIVE |
| Rift Valley Fever virus (RVFV) | NEGATIVE | NEGATIVE | NEGATIVE | NEGATIVE |
| Crimean-Congo Hemorrhagic Fever virus (CCHFV) | 38.871 | 85 | NEGATIVE | NEGATIVE |
NEGATIVE denotes no detectable amplification or Tm. Superscript numbers indicate the number of expressed wells.
Plaque assay quantification of LSV in Vero, Vero-Furin, Vero-DC-SIGNR, and HMEC-1 cell lines
No replicable plaques were detected in any cell line regardless of the absorption temperature, incubation time, or expressed receptors in transfected cell lines (data not shown). Incubation over 11 days in Vero cells resulted in the death of cells unrelated to infection, as determined by the presence of cell death in negative controls. The plaque assay results suggested that the sample of LSV used in this study was unable to induce CPEs and plaque formation in the cell types and conditions used.
Quantifying viral titers in vitro with the LSV-M and LSV-S assays and comparing the methods of quantification
Due to the absence of replicable plaque formation in plaque assays, we tested the developed primers in experimentally infected Vero cells to assess viral replication. Both assays expressed a similar pattern of viral titer amplification, suggesting the detection and quantification of LSV by either assay was indiscriminate based on segment choice (Fig 4A and B). The quantification results also suggested that LSV was infecting and replicating in Vero cells despite the absence of plaque formation.
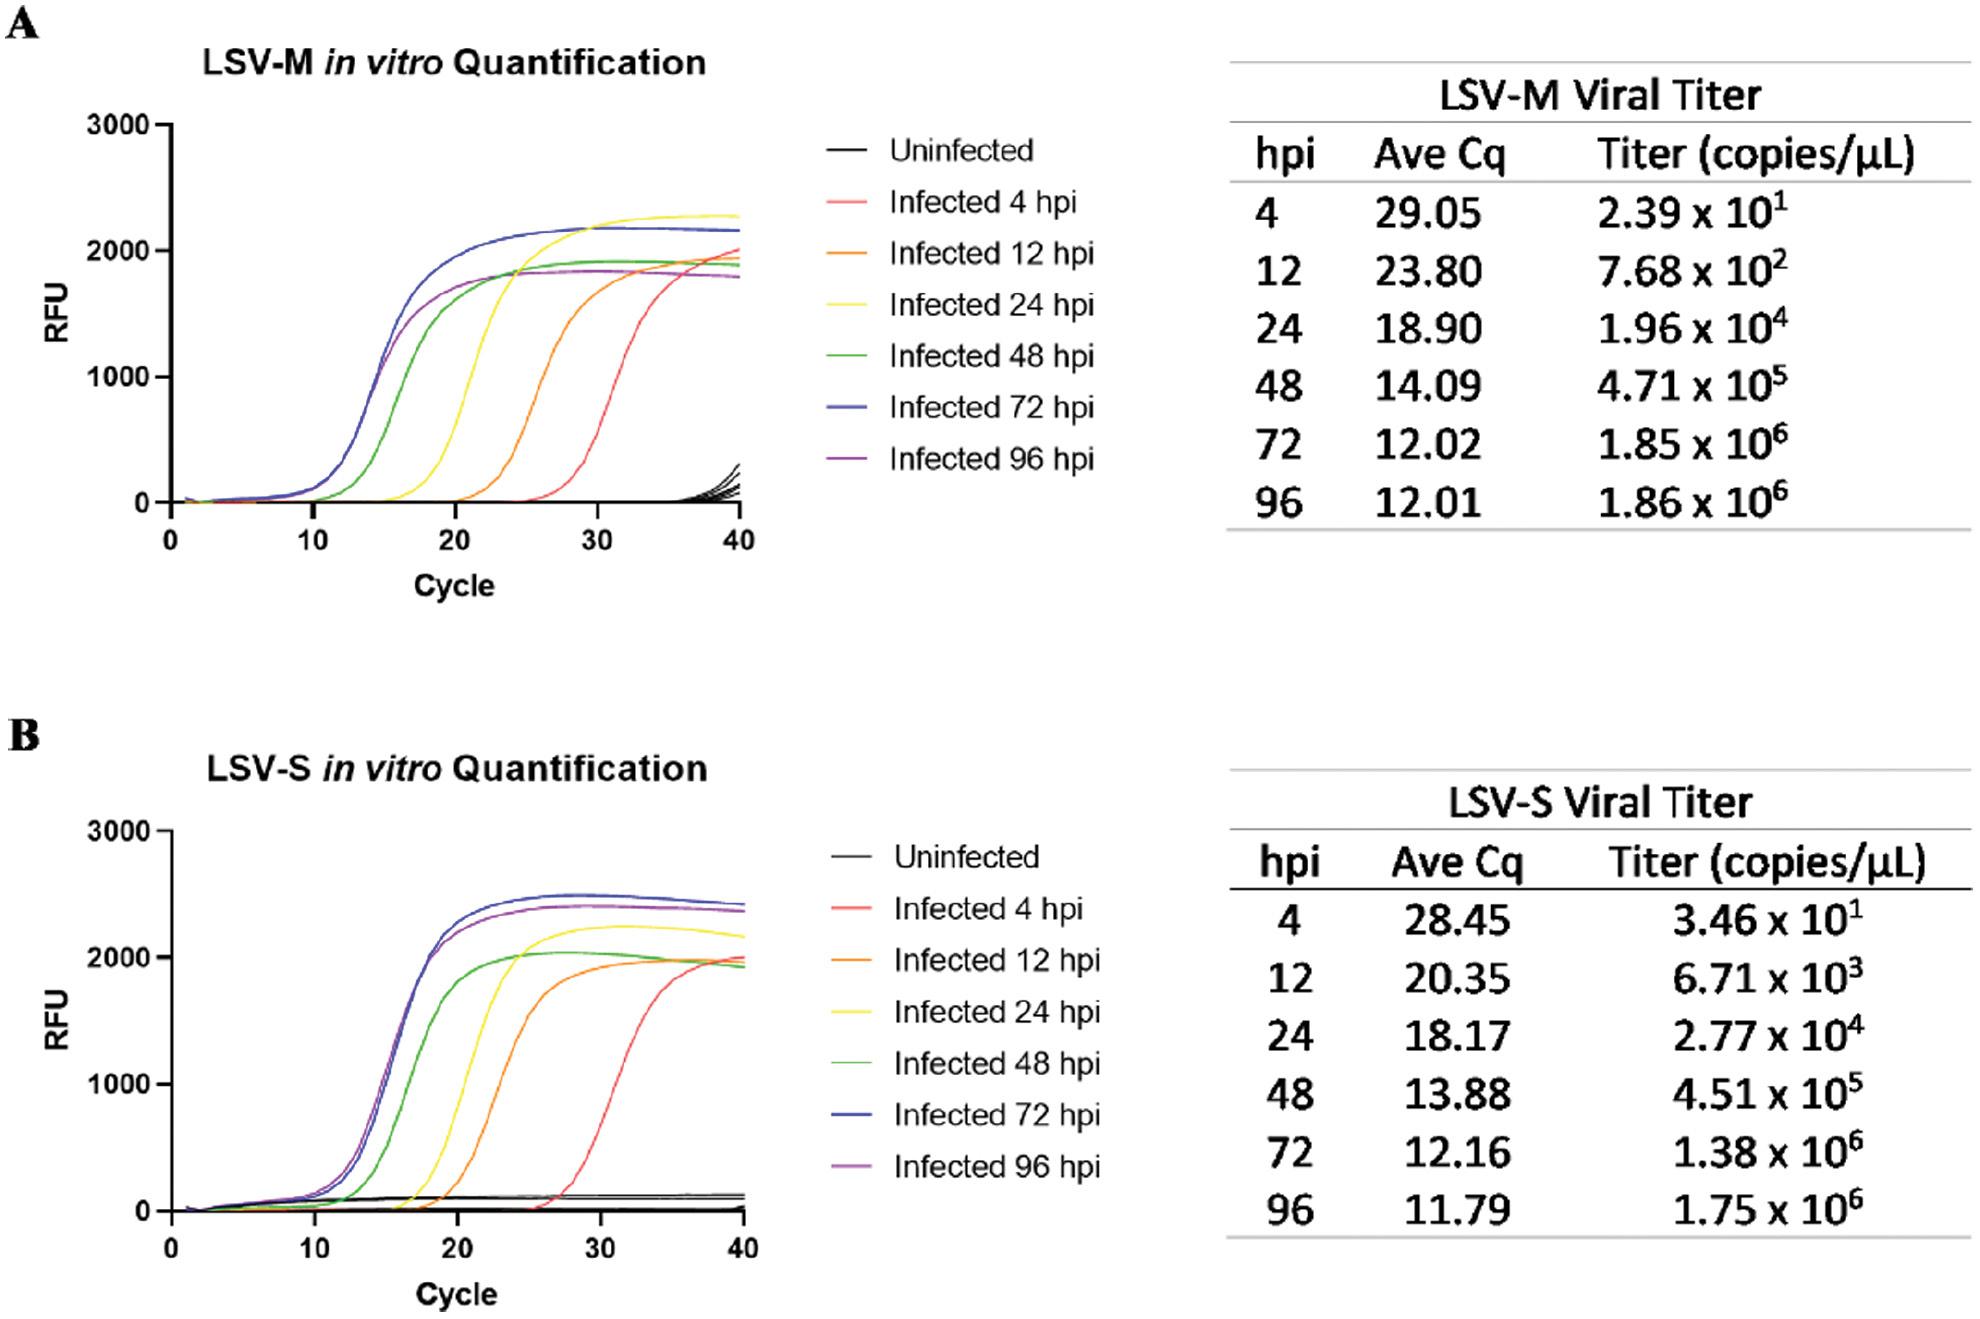
Amplification and determination of viral titers of Vero cells infected with LSV using LSV-M and LSV-S assays. Amplification plots and Cq show only the average amplification of the replicates for the (A) LSV-M and (B) LSV-S assays. Uninfected cells (indicated as black lines) did not reach the amplification threshold. RFUs: relative fluorescence units.
Field investigation of ticks in southeast Texas using the LSV-M and LSV-S assays
To assess the potential presence of LSV in southeast Texas, we tested 143 ticks with the developed assays. Sex, species, and location collection percentages are shown in Fig 5. Bodily disfigurement from collection resulted in the inability to confidently identify tick sex or species; therefore, these specimens were labeled as “unknown.” Each tick was processed individually for RNA extraction and RT-qPCR. No ticks tested positive for the presence of LSV with either the LSV-M or LSV-S assay.
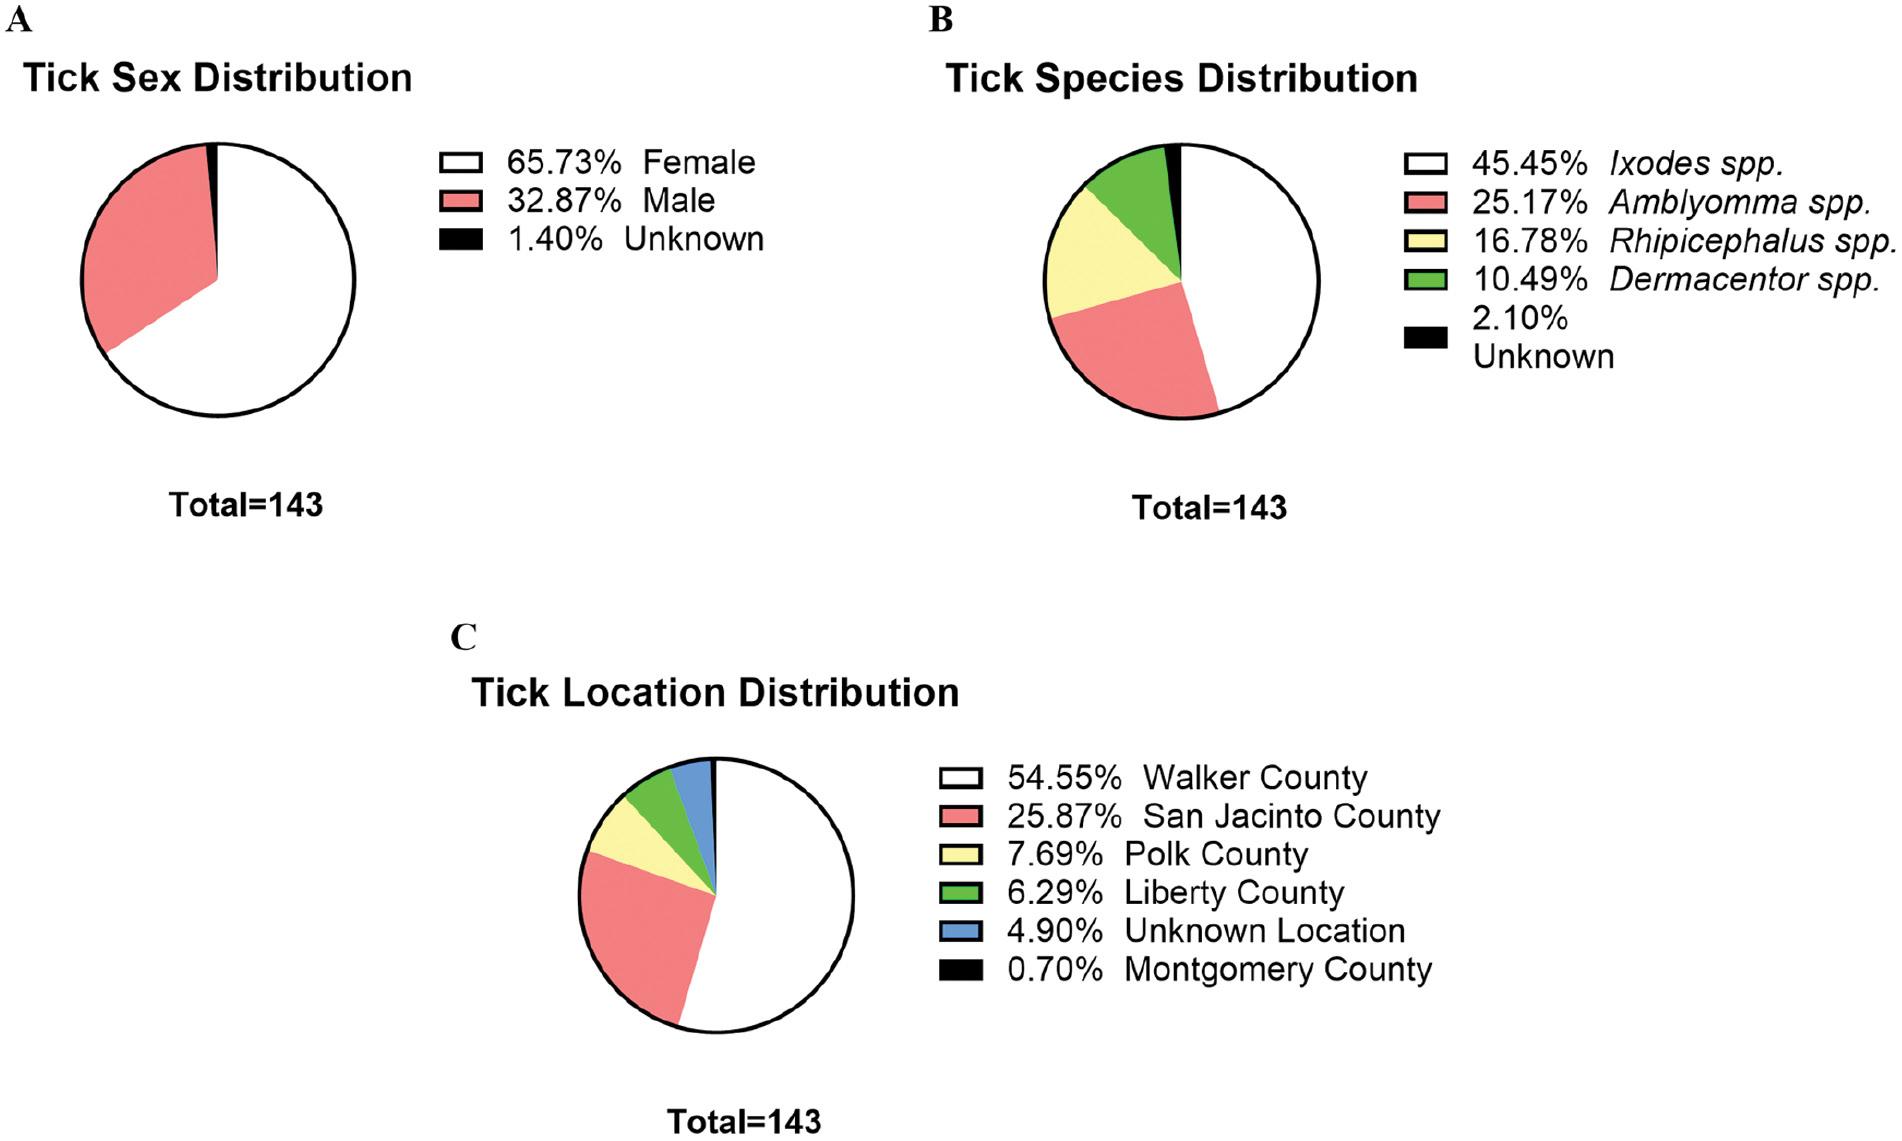
Tick sex, species, and location distribution. The distribution of collected ticks based on (A) sex, (B) species, and (C) location collected is shown. Tick sex and species were determined by visual observation and light microscopy guided by several published taxonomic keys for identification.
DISCUSSION
LSV is an understudied tick-borne virus with pathogenic potential; however, no published method for specific detection is available. Due to the lack of information and quantity of sequenced isolates, we utilized SYBR green-based chemistry as opposed to probe-based chemistry. SYBR green-based chemistry is less specific; however, non-specific products can be assessed through the use of a melt curve [29]. Probe-based chemistries are highly specific for the amplification targets due to the use of primers and a sequence-specific probe. Using a less specific detection system, such as SYBR green-based chemistry, may be more advantageous to detect environmental isolates that may contain single-nucleotide polymorphisms between the primer binding regions that would not affect the ability of the developed assay to detect the virus. Confirmation of detection could be performed through next-generation sequencing when detecting environmental isolates.
The standard curve data for the LSV-M and LSV-S assay indicate that the primer pairs developed in this assay are sufficient for producing standard curves for viral quantification. The E of all runs was >90%, indicating the primers were efficiently binding and initiating replication of the template with each amplification cycle. Additionally, the CV data indicated that amplification with the primer pairs resulted in low variation between replicates and runs, indicating the use of the primers did not result in a high variation between concentrations. These results suggested that the LSV-M and LSV-S primers produced highly reproducible standard curves using a purified fragment of the LSV genome for viral quantification.
The LOD was assessed by testing the lower limits of viral quantification for each primer pair. The concentration range for the LOD experiment was used to determine at what point the assay had little-to-no detection. Both assays detected <2 copies/μL of viral RNA based on the 95% LOD and <1 copy/μL for the 50% LOD. The Co for each assay was determined by the 50% LOD, which corresponded to 36.82 cycles for the LSV-M assay and 36.29 cycles for the LSV-S assay based on the LOD experiment. The Co for these assays indicates amplification after the specified cycles is likely non-specific; however, the Tm can be assessed if amplification surpasses the Co [30]. Additionally, more rigorous exclusion parameters can be set by using the 95% LOD instead of the 50% LOD. The LOD data indicated that the assays were highly sensitive for LSV in purified viral samples. In the future, it would be important to test the ability of the assays to detect low concentrations of LSV in more complicated samples, such as RNA extractions from cell lysates or whole ticks.
The specificity of the developed assays was tested through off-target amplification of related and relevant viruses with the developed primers. Amplification of viruses with the LSV-M assay showed off-target detection in 4 of the 11 tested viruses based on the set Co, each with a dissimilar Tm. Any amplification of tested viruses with the LSV-S assay surpassed the Co, and the melt curve analysis further indicated off-target amplification could be distinguished from LSV. The detection of UUKV with the LSV-M assay resulted in a similar Tm as LSV. Notably, amplification for UUKV surpassed the Co and the dissociation curve was distinguishable from LSV due to several peaks appearing in the curve. However, the possibility of random experimental results for the UUKV Tm cannot be ruled out due to the limited number of samples assessed in this study and further exploration is warranted. Importantly, off-target assessment of HRTV and BRBV were highly relevant for this study. A. americanum, the only known vector for LSV, is the vector for HRTV and has been suggested to be the vector for BRBV, indicating vector and geographic overlap [11,31]. In this study there was no detection of BRBV with either assay and only a singular amplification of HRTV with the LSV-M assay with a dissimilar Tm. Based on these results, the LSV-S primers were highly specific for LSV, while the LSV-M primers exhibited some cross-reactivity with tested viruses. However, because both assays were highly sensitive for LSV, the primer sets can be used in tandem for primary sensitive screening and secondary confirmation. Furthermore, including replicates when testing samples for LSV to prevent potential erroneous interpretations of the results is indicated.
Plaque assays yielded no replicable results in any tested cell line. In a previous study, LSV developed plaques in Vero cell culture at 72 hpi [7]. Additionally, a previous study noted vacuole formation at 72 hpi with progressive development of CPEs. All plaque assays in this study in Vero cells were performed for at least 4 d (96 hpi), persisting to at most 11 d (264 hpi). The viral incubation temperature was missing from the previous literature on LSV, which introduced a significant issue in reproducing plaques. In this study several variations of cell types, absorption temperatures, and incubation times were attempted with no presentation of CPEs or plaque formation. Our reasoning for testing the 37°C absorption temperature with an incubation range from 4–11 d was that the temperature aligned with several related virus plaque assay protocols. Several studies performed plaque assays with absorption at 37°C with incubation times ranging from 4–14 d post-infection, including HRTV [32], SFTSV [33–36], and PTV [37]. Work on Colorado tick fever virus (CTFV), another TBV in the US, reported that the infectivity of an extracellular virus was preserved and resulted in greater accuracy in quantification by carrying out the absorption period at RT instead of 37°C [38]. This study utilized the RT absorption modification for plaque assays, but this method also yielded no plaque formation.
Because no notable CPEs or plaque formation was observed in our study, the plaque assay results suggested that the ability of LSV to induce plaque formation was inconclusive and necessitated further research. Aside from methodology, one possible reason for the difference in this work compared to previous publications on LSV may be a mutation in the virus sample tested here that reduced the ability of the virus to cause CPEs and plaque formation. To explore this possibility, the virus used in this study was fully sequenced and compared to the currently published sequence for LSV. An alternative approach was to perform a focus-forming assay using LSV immune ascitic fluid to determine if foci were present instead of plaques.
While this study did not reproduce plaque formation, it was apparent that the virus was infecting and replicating, as indicated by the in vitro quantification results. According to the quantification results, both assays reported a similar pattern of viral replication detection, indicating either assay could be used to monitor LSV replication in vitro. RT-qPCR in viral load detection and monitoring is a useful indicator of active infection, virus-host interaction, and response to antiviral therapy [39]. Future research may test the viral kinetics of LSV in other cell lines, such as those used in extant literature and the additional cell lines used in this study. Additional research may delve into viral kinetics and pathogenesis of LSV infection, especially if plaque assays cannot be used to monitor active virus.
A caveat for this study was that RT-qPCR was limited to only quantifying replicated RNA and was unable to differentiate between infectious and non-infectious viral particles. Noroviruses cannot be grown in vitro and are typically quantified using RT-qPCR, which presents a similar issue for viral quantification [40]. However, the integrity of crucial viral proteins essential to forming an intact and infectious viral particle can be assessed with RT-qPCR; this approach can offer a more informed prediction for infectious viral quantification. Similarly, this method may be useful to apply to LSV to better predict functional and infectious viral particles for confidence in viral quantification.
For this study, 143 ticks were collected and tested for the presence of LSV using the developed assays. No ticks in this study tested positive for the presence of LSV. This study was limited in sampling amount and area. Optimally, this study would have primarily focused molecular testing on A. americanum ticks, because the ticks are the only known vector of LSV. However, there have been several cases of natural or experimental spillover of related and relevant viruses in other tick vectors, including HRTV and BRBV in H. longicornis and SFTSV in Dermacentor silvarum [8,41,42]. Based on these findings, future studies should continue to survey a variety of ticks over an expansive geographic range for the presence of LSV.
CONCLUSION
Emerging TBDs have been progressively increasing as a threat to public health, with several newly emerged viruses causing severe and sometimes fatal illnesses. This increased threat highlights the need for heightened surveillance of emerging TBVs. LSV is a potential tick-borne viral pathogen with no published methods of specific detection. In the current study two primer sets for the LSV M and S segments for sensitive, specific, and reproducible detection and quantification utilizing SYBR green-based RT-qPCR were developed and validated. This research is significant because a means to routinely detect and quantify LSV in vitro was demonstrated.